
Figures & data
Figure 1. Met oxidation levels (%) in mAb1 by LC-MS/MS peptide mapping. The oxidation level for each Met residue is plotted with increasing percentage of peracetic acid (% PAA). The PAA percentage represents the molar concentration of PAA to the total molar concentration of Met residues in mAb1.
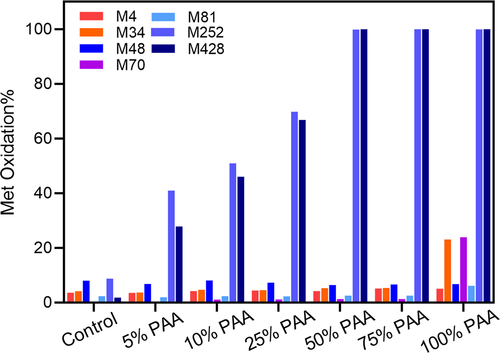
Figure 2. Representative thermographs of mAb1 at different PAA levels.Tm1, Tm2, Tm3 represent the melting transition temperature for CH2, Fab, and CH3 domains, respectively.
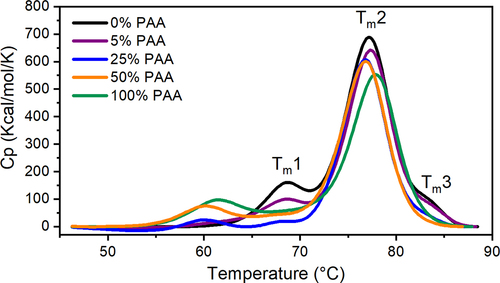
Figure 3. Representative far-UV CD spectra of oxidized mAb1 samples overlaid with the control.
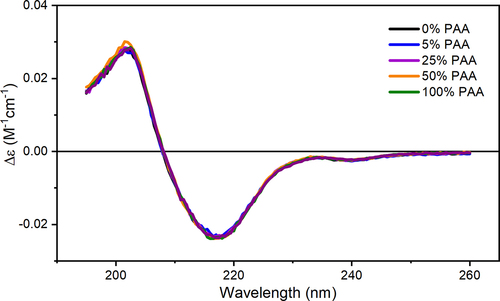
Figure 4. Representative near-UV CD spectra of Met oxidized mAb1 samples and the control. Phe, Tyr, and Trp regions are highlighted in color.
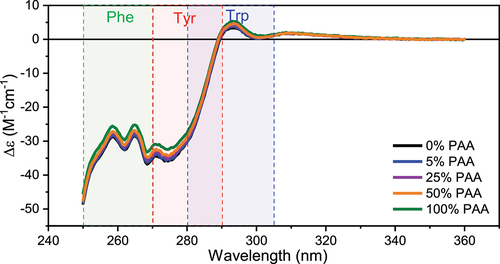
Figure 5. (A) Tryptophan fluorescence spectra of Met oxidized mAb1 samples and the control: (B) Bar graph of the maximum fluorescence intensity and error bar.
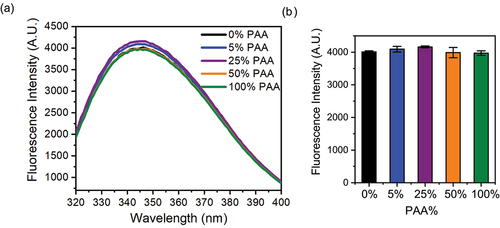
Figure 6. Chemometric analysis of 1D 1H NMR spectral differences between Met oxidized mAb1 and the control. (A) Representative 1D 1H NMR spectra of Met oxidized mAb1 at 0%, 5%, 25%, and 100% PAA. Blinded spectral regions including polysorbate peaks and residual water signal shown in gray are excluded from the analysis. (B) Plot of the similarity score from PROFILE analysis of the amide/aromatic and methyl group regions. The dotted lines represent 2SD from the mean value of the intra-sample comparisons. (C) PCA score plot of PC1 and PC2 from the analysis of the spectra shown in (A). Replicate experiments are shown in the same color with the 95% confidence ellipses drawn (for control and 25% PAA data, the confidence ellipses are very small and within the area described by the corresponding clustered datapoints). The explained variances for the corresponding principal component are labeled on the axis.
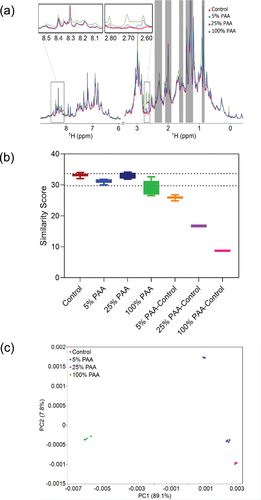
Figure 7. 2D PCA analysis of mAb1 reference and oxidized samples. (A) Representative 2D 1H-13C methyl NMR spectra of Met oxidized mAb1 samples and the control. Excipient peaks and noise regions are excluded from the analysis and shown in gray. One replicate from each condition is shown. The zoomed view of Met Hε-Cε region are stacked on the right. The Met H-C peaks gradually disappear with an increasing PAA percentage. (B) PCA score plot of PC1-PC2 from analysis of the methyl group region. The ellipses represent 95% confidence region. The explained variance is labeled on the axis.
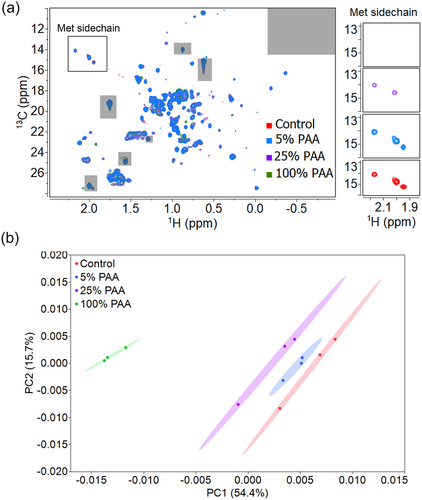
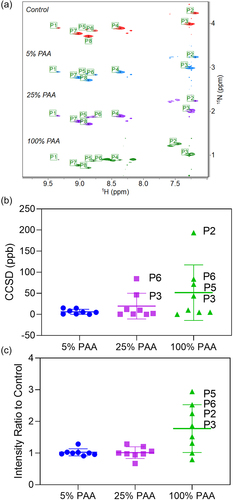
Figure 8. (A) Stacked 2D 1H-15N NMR spectra of Met oxidized mAb1 with the control. The Met amide peaks are automatically identified and labeled as P1 to P8. The plot of CCSD (B) and intensity ratio (C) comparison of Met residues in mAb1 under PAA oxidation conditions with the control. Individual value for each residue, mean value, and standard deviation are plotted.
LiM_2023_0188R1_SI_4Dec2023.docx
Download MS Word (8.3 MB)Data availability statement
The data that support the findings of this study are available on request from the corresponding author, M. Li.