Figures & data
Figure 1. hF5-WT and hF5-LALA binding and neutralization potency. hF5-WT, hF5-LALA mutant, and human IgG isotype control binding to immobilized, recombinant VEEV-TC83 E1E2 trimer (a), and VEEV-TrD E1E2 trimer (b) mean and standard deviation (SD) from experiments performed in duplicate on gyrolabs immunoassay platform. BLI kinetic sensorgrams for hF5-WT (c) and hF5-LALA (d) against recombinant VEEV-TC83 E1E2 trimer. Table with equilibrium dissociation constant (KD), on-rate (ka), and Off-rate (kd) calculated from BLI kinetics experiments (e). TC83 neutralization and calculated IC50 values for hF5-WT and hF5-LALA calculated from plaque neutralization assay (PNA) experiments performed in triplicate (f). SINV-TrD GFP neutralization and calculated IC50 values for hF5-WT and hF5-LALA calculated from focus forming unit neutralization experiments performed in triplicate (g). Representative data shown for one of three independent experiments.
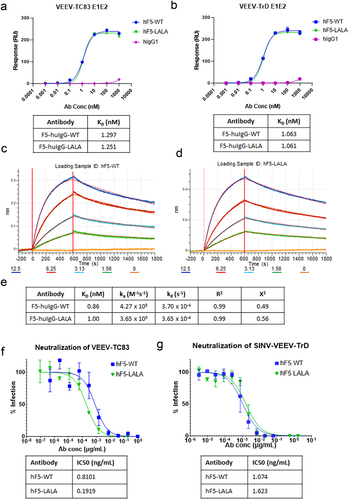
Figure 2. Complement binding and fixation with hF5-WT and hF5-LALA. hF5-WT and hF5-LALA mutant ab binding complement (C1q) from normal mouse serum (NMS) and normal human serum (NHS), (panel a and b, respectively). hF5-WT and hF5-LALA ab complement C3 fixation in the presence of NMS and NHS (panels c and d, respectively.) hF5-WT ab binds C1q in mouse and human sera, while hF5-LALA exhibits reduced binding to C1q and C3 fixation in human and mouse sera. Data are from experimental conditions performed in triplicate, and the error bars represent the standard deviation from the mean. P values considered significant if < .05 (*), or very significant if < .01 (**), < .001 (***), or < .0001 (****).
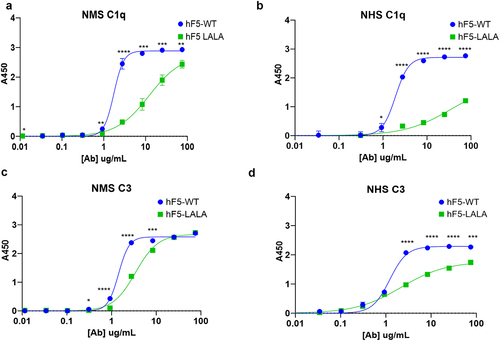
Figure 3. Real-time complement dependent cytotoxicity of hF5-WT and hF5-LALA. Schematic diagram illustrating RT-CDC assay conditions (a). Percent cell viability of Vero cells over the course of VEEV-TC83 infection for 48 h with hF5-WT and hF5-LALA, wells spiked with mouse (b) or human (c) sera at 8hpi (red arrows). % viability = [(number of blue cells – number of red cells)/number of blue cells] *100. Blue signal indicates Hoechst+, red and blue indicates Hoechst+ propidium iodide+. Images of NMS and NHS assays are taken from timecourse videos that span 9-25hpi (hours post infection). All image snapshots are taken at 24hpi. NMS treated hF5-WT (D, S1 video), hIgG1 (E, S2 video), and hF5-LALA (F, S3 video). NHS treated hF5-WT (G, S4 video), hIgG1 (H, S5 video), and hF5-LALA (I, S6 video). CDC activity was pronounced in hF5-WT treated wells with both mouse and human sera, whereas hF5-LALA mutant treatment with mouse or human sera showed significantly reduced cytotoxicity. In CDC-NMS assay, hIgG1 v hF5-WT p < 0.0001, hF5-WT v hF5-LALA p < 0.0001, hIgG1 v hF5-LALA p = 0.0001. In CDC-NHS assay, hIgG1 v hF5-WT and hF5-LALA p < 0.0001, hF5-WT v hF5-LALA p = 0.0013, by paired t-test. Data shown is representative of three or more experiments, each with three technical replicates (b and c), quantified using CellInsight C×7High Content Analysis software. Images (d-i) taken at 10X magnification on a CellInsight C×7High Content imaging platform.
![Figure 3. Real-time complement dependent cytotoxicity of hF5-WT and hF5-LALA. Schematic diagram illustrating RT-CDC assay conditions (a). Percent cell viability of Vero cells over the course of VEEV-TC83 infection for 48 h with hF5-WT and hF5-LALA, wells spiked with mouse (b) or human (c) sera at 8hpi (red arrows). % viability = [(number of blue cells – number of red cells)/number of blue cells] *100. Blue signal indicates Hoechst+, red and blue indicates Hoechst+ propidium iodide+. Images of NMS and NHS assays are taken from timecourse videos that span 9-25hpi (hours post infection). All image snapshots are taken at 24hpi. NMS treated hF5-WT (D, S1 video), hIgG1 (E, S2 video), and hF5-LALA (F, S3 video). NHS treated hF5-WT (G, S4 video), hIgG1 (H, S5 video), and hF5-LALA (I, S6 video). CDC activity was pronounced in hF5-WT treated wells with both mouse and human sera, whereas hF5-LALA mutant treatment with mouse or human sera showed significantly reduced cytotoxicity. In CDC-NMS assay, hIgG1 v hF5-WT p < 0.0001, hF5-WT v hF5-LALA p < 0.0001, hIgG1 v hF5-LALA p = 0.0001. In CDC-NHS assay, hIgG1 v hF5-WT and hF5-LALA p < 0.0001, hF5-WT v hF5-LALA p = 0.0013, by paired t-test. Data shown is representative of three or more experiments, each with three technical replicates (b and c), quantified using CellInsight C×7High Content Analysis software. Images (d-i) taken at 10X magnification on a CellInsight C×7High Content imaging platform.](/cms/asset/b47d37be-d73b-48f7-8902-079de3e6cfa1/kmab_a_2297451_f0003_oc.jpg)
Figure 4. FcγR binding with hF5-WT and hF5-LALA. hF5-WT and hF5-LALA mutant Ab binding murine FcγRs I (a), IIb (b), III (c), and IV (d). hF5-WT and hF5-LALA Ab binding to human FcγRI (e). hF5-WT Ab binds to both mouse and human FcγR I orthologs, and mouse FcγRIV, but fails to bind to murine FcγR IIb and III, while the hF5-LALA mutant exhibits abrogated binding to all murine FcγRs and substantially reduced binding to human FcγRI. Data are from experimental conditions performed in triplicate, and the error bars represent the standard deviation from the mean. P values considered significant if < .05 (*), or very significant if < 0.01 (**), <.001 (***), or < .0001 (****).
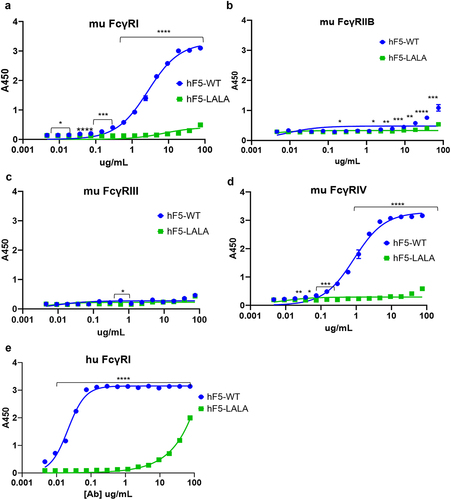
Figure 5. Real-Time Ab-Dependent-Cell-mediated-Cytotoxicity of hF5-WT and hF5-LALA. Schematic diagram illustrating RT-ADCC assay conditions (a). Percent cell viability of Vero cells over the course of VEEV-TC83 infection for 48h with hF5-WT and hF5-LALA, wells spiked with RAW mouse (b) or THP1 human (c) macrophages (Mφ) at 8hpi (red arrows). % Viability = [(number of blue cells – number of red cells)/ number of blue cells] *100. Blue signal indicates Hoechst+, red and blue indicates Hoechst+ propidium iodide+. Images of murine RAW macrophage-treated timecourse taken at 24hpi (hours post infection). hF5-WT (d, S7 Video), hIgG1 (e, S8 Video), and hF5-LALA (f, S9 Video). Images of human THP1 macrophage-treated timecourse taken at 24hpi (hours post infection). hF5-WT (g, S10 Video), hIgG1 (h, S11 Video), and hF5-LALA (i, S12 Video). ADCC activity was pronounced in hF5-WT treated wells with both mouse and human Mφ, whereas hF5-LALA mutant treatment with mouse or human Mφ completely abrogated ADCC; hF5-LALA cytotoxicity follows VEEV-TC83 infection cytopathic kinetics. In ADCC-RAWs assay, hIgG1 v hF5-WT p < .0001, hF5-WT v p < .0001, hIgG1 v hF5-LALA was not significant. In ADCC-THP1 assay, hIgG1 v hF5-WT p = .0004, and hF5-WT v hF5-LALA p = .0006, hIgG1 v hF5-LALA p = .0138 by paired t-test. Data shown is representative of three or more experiments, each with three technical replicates (B and C), quantified using CellInsight CX7 High Content Analysis software. Images (D-I) taken at 10X magnification on a CellInsight CX7 High Content Imaging platform.
![Figure 5. Real-Time Ab-Dependent-Cell-mediated-Cytotoxicity of hF5-WT and hF5-LALA. Schematic diagram illustrating RT-ADCC assay conditions (a). Percent cell viability of Vero cells over the course of VEEV-TC83 infection for 48h with hF5-WT and hF5-LALA, wells spiked with RAW mouse (b) or THP1 human (c) macrophages (Mφ) at 8hpi (red arrows). % Viability = [(number of blue cells – number of red cells)/ number of blue cells] *100. Blue signal indicates Hoechst+, red and blue indicates Hoechst+ propidium iodide+. Images of murine RAW macrophage-treated timecourse taken at 24hpi (hours post infection). hF5-WT (d, S7 Video), hIgG1 (e, S8 Video), and hF5-LALA (f, S9 Video). Images of human THP1 macrophage-treated timecourse taken at 24hpi (hours post infection). hF5-WT (g, S10 Video), hIgG1 (h, S11 Video), and hF5-LALA (i, S12 Video). ADCC activity was pronounced in hF5-WT treated wells with both mouse and human Mφ, whereas hF5-LALA mutant treatment with mouse or human Mφ completely abrogated ADCC; hF5-LALA cytotoxicity follows VEEV-TC83 infection cytopathic kinetics. In ADCC-RAWs assay, hIgG1 v hF5-WT p < .0001, hF5-WT v p < .0001, hIgG1 v hF5-LALA was not significant. In ADCC-THP1 assay, hIgG1 v hF5-WT p = .0004, and hF5-WT v hF5-LALA p = .0006, hIgG1 v hF5-LALA p = .0138 by paired t-test. Data shown is representative of three or more experiments, each with three technical replicates (B and C), quantified using CellInsight CX7 High Content Analysis software. Images (D-I) taken at 10X magnification on a CellInsight CX7 High Content Imaging platform.](/cms/asset/a366ff4a-7067-42bd-add8-48f7b6da3ce5/kmab_a_2297451_f0005_oc.jpg)
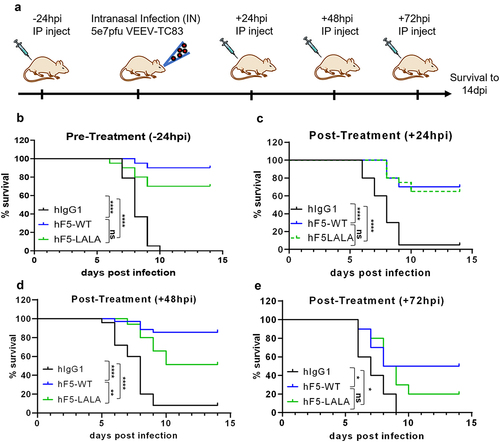
Figure 6. in vivo efficacy of hF5-WT and hF5-LALA dosed prophylactically and therapeutically. Schematic of dosing and infection timeline through 14 dpi (days post infection) survival (a). Prophylaxis study involved a -24-h pre-infection 100ug dose of Ab (b), while therapeutic studies included +24hpi (c), +48-h (d), and +72-h (e) post-exposure 100ug dose. Animals were infected intranasally (IN) with 5e7pfu VEEV-TC83, and survival was measured to 14dpi. Pre-treatment (-24hpi) and early exposure (+24hpi) animals receiving hF5-WT or hF5-LALA Ab showed comparable survival rates, while in the +48hpi post-exposure context, hF5-LALA-treated animals did exhibit a significant reduction in survival. By +72hpi both hF5-WT and hF5-LALA -treated individuals showed similarly high degrees of mortality, indicating a diminishing therapeutic benefit regardless of Fc effector function, in the context of an established VEEV infection. For the -24hpi (hours post infection) study hIgG1 v. hF5-WT ****p< .0001, hIgG1 v. hF5-LALA ****p < .0001, hF5 v. hF5-LALA was not significant (p = .1034). For the +24hpi study hIgG1 v. hF5-WT ****p< .0001, hIgG1 v. hF5-LALA ****p< .0001, hF5-WT v. hF5-LALA was not significant (p = .7818). For the +48hpi study hIgG1 v. hF5-WT ****p< .0001, hIgG1 v. hF5-LALA ****p< .0001, hF5-WT v. hF5-LALA **p= .0036. For the +72hpi study hIgG1 v. hF5-WT *p = .0190, hIgG1 v. hF5-LALA *p = .0343, hF5-WT v. hF5-LALA was not significant (p= .3751), by Log-rank Mantel-Cox test. In -24hpi and +24hpi studies n=20; in +48hpi studies n=35; and in +72hpi study n=10. Data shown represent at least two experiments, except for the +72hpi study, performed once.