Figures & data
Figure 1. Workflow for the development of lectin chips for IgG mAbs. The left panel illustrates the nine glycan epitopes found in therapeutic IgG mAbs, which served as a reference for identifying lectins as binding partners. A total of 74 lectins, including 45 naturally occurring lectins and 29 recombinant lectins, were printed onto glass chips. These lectin chips were then exposed to Cy3-labeled glycoprotein samples with known glycan profiles, such as IgG1 mAbs and other therapeutic glycoproteins. The resulting binding signals were compared to the known selectivity of individual lectins, enabling the identification of nine distinct lectins that exhibited desirable selectivity toward specific glycan epitopes. Subsequently, these nine lectins were used to fabricate the lectin microarray chips, referred to as the LecChip-IgG-mAb.
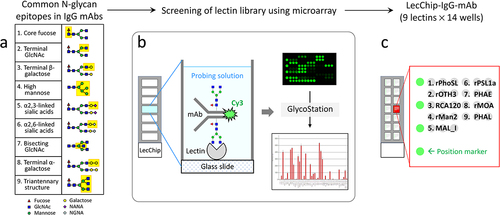
Table 1. Selected lectins (n = 9) for capturing the common glycan epitopes of therapeutic IgG mAbs.
Table 2. Therapeutic protein samples tested using the LecChip-IgG-mAb microarray.
Figure 2. Qualification of LecChip-IgG-mAb using model samples with known glycan profiles. Two non-glycosylated therapeutic proteins (filgrastim and IgG1 atezolizumab), along with three N-glycosylated IgG1 mAbs produced by different cell lines (NISTmAb, trastuzumab, and cetuximab) were subjected to testing using LecChip-IgG-mAb (see details in the materials and methods section). Representative raw images acquired at 1-second scan and 10-second scan are shown (a). The LecChip binding signals (b) were used to determine the relative abundance of individual N-glycan epitopes based on the known selectivity of each lectin (table 1). The error bars represent standard deviation (n = 3) derived from three independent experiments.*PHAE signal should only be used to evaluate samples containing predominantly bisecting glycans (see glycoengineering section). Additionally, a saturated signal was detected at approximately 50,000 net fluorescence intensity, exceeding the lectin chips’ dynamic range. For a more detailed analysis of specific N-glycan epitopes (core fucose, triantennary N-glycan, and sialic acids (SAs)) among glycoprotein samples, three paired samples were applied onto the LecChip-IgG-mAb and scanned after a 2 second exposure (c). The yellow line box on each image indicates the location of triplicate spots for each lectin specified above the image.
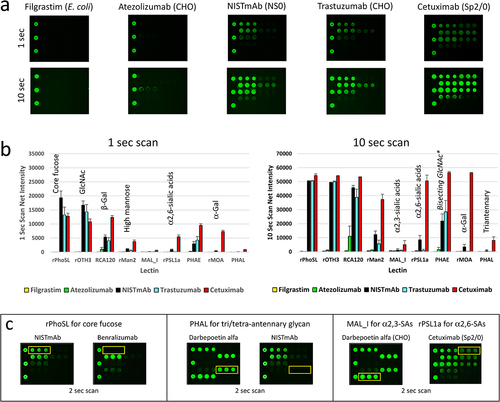
Figure 3. Qualification of LecChip-IgG-mAb through targeted glycoengineering of therapeutic IgG1 mAbs. The terminal N-glycan epitopes of the IgG1 mAbs shown in panels a to g were subjected to in vitro glycoengineering, as described in the materials and methods. The modified glycoforms were then confirmed through mass spectrometry, utilizing reduced intact protein samples (a-g, left panels). In parallel, a separate set of samples was analyzed using lectin microarray (a-g, right panels), which revealed consistent glycan profiles across all tested samples.
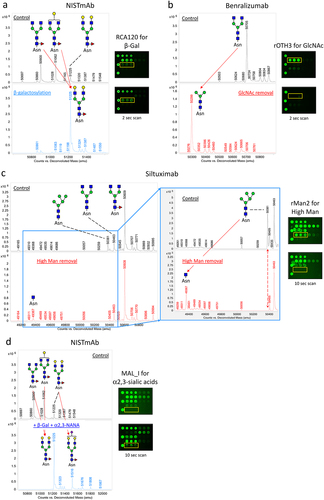
Figure 3. (Continued).
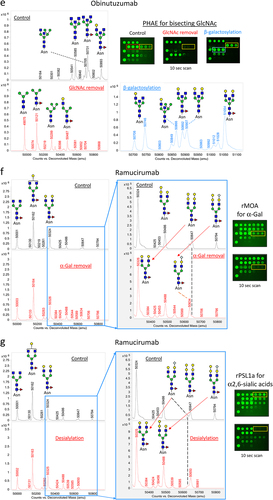
Figure 4. Comparative glycan profiling of infliximab and its biosimilars produced in two different expression systems. Infliximab and its biosimilars, infliximab-dyyb infliximab-abda, and infliximab-axxq, were subjected to analysis using the LecChip-IgG-mAb. Shown are the microarray images (a) and glycan profiles (b) derived from 1-second and 10-second exposures. The error bars represent standard deviation (n = 3) from three independent experiments.
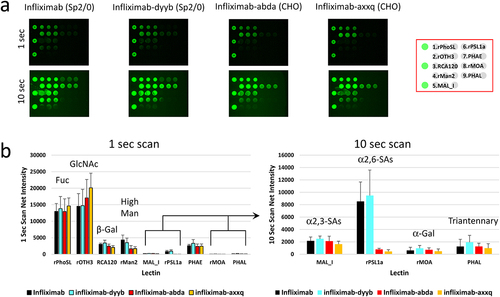
Figure 5. Applications of LecChip-IgG-mAb in glycan profiling of various mAb types. The IgG1-Fc fusion protein etanercept, IgG1 ADC ado-trastuzumab emtansine, IgG2 mAb panitumumab, and IgG4 mAb pembrolizumab, all produced in CHO cells, were analyzed using the LecChip-IgG-mAb. Shown are the glycan profiles obtained from 1-second exposures. The error bars represent standard deviation (n = 3) from three independent experiments.
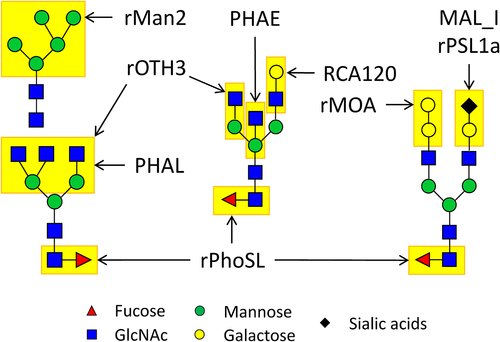
Figure 6. Schematic view of N-glycan epitopes identified on IgG mAbs, anticipated to engage with the nine lectins on the LecChip-IgG-mAb. Notably, lectin MAL_I binds to α-2,3 linkages, while rPsl1a recognizes α-2.6 linkages, primarily associated with NANA and NGNA present on glycans produced within CHO and murine cells.