Figures & data
Figure. Structure of h1340.CC fab bound to human PD-1. (a) overview structure, with interfacing residues in HC, LC and PD-1 colored dark green, dark purple and orange, respectively. The non-canonical disulfide is shown in red. (b-d) Close-up view of main interaction interfaces labeled in panel a, with key residues forming contacts shown as sticks. Polar contacts are shown as dashed yellow lines.
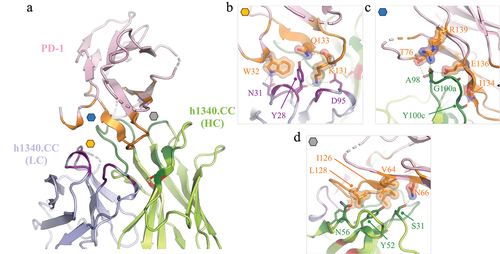
Figure 2. Epitope comparison for human, cyno and mouse PD-1. (a) Structure of hPD-1, with residues at the fab interface (within 4.5 Å) highlighted in orange, and residues contacting the CDRs shown as sticks and labeled. (b) Sequence alignment of residues–150 of human, cyno and mouse PD-1 (uniprot identifiers Q15116, B0LAJ3 and Q02242, respectively), with key interacting residues boxed in orange. Residues conserved across all 3 species are highlighted in green, while residues that differ in mouse are highlighted in blue. The signal sequence is shown in gray, and N- and C-terminal residues that are resolved in the structure are indicated by arrows.
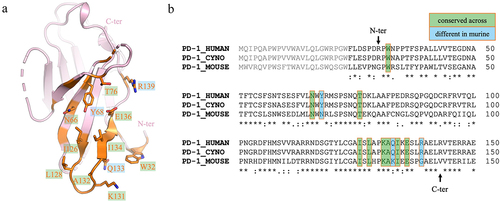
Figure 3. Structural context of the h1340.CC disulfide bond suggests engineering opportunities beyond C35a and C50. The direct environment of the C35a – C50 disulfide bond facing toward (a) and away (b) from hPD-1 suggests residue engineering opportunities to recover hPD-1 affinity after disulfide removal. The light chain of h1340.CC has been omitted for clarity. Key residues (colored dark green) on the heavy chain (colored light green) of h1340.CC that pack against the disulfide (colored red) or mediate hydrophobic interactions with hPD-1 residues Ile126, Leu128, Ala132, and Ile134 are shown in sphere and stick representation. Residues that differ from human to mouse PD-1 are shown in bright pink (Y68N & Q133K).
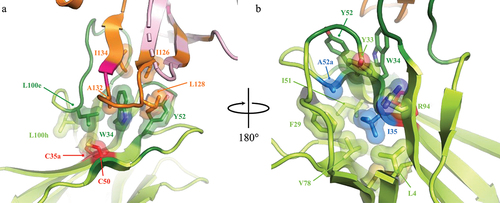
Figure 4. h1340.CC variants binding affinity to hPD-1 assessments by SPR. The red circle indicates clone h1340.SA.LV in set 3 with improved hPD-1 affinity compared to the initial h1340.SA variant (KD: 0.7 nM) and within two-fold of affinity of parental clone h1340.CC (KD: 0.1 nM). The KD value is determined at 25°C.
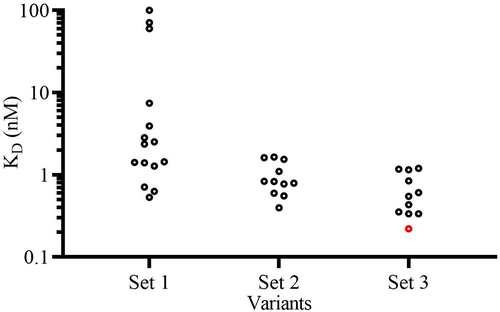
Table 1. Functional characterization of h1340.CC and engineering variants in binding. Parameters (kon, association rate constant; koff, dissociation rate constant; KD, equilibrium constant) are determined at 37°C as mean ± S.D from duplicates.
Figure 5. Functional characterization of h1340.CC & h1340.SA.LV in binding and blocking. (a) Cell surface PD-1 binding analysis by FACS. CHO-hPD-1: CHO expressed human PD-1; CHO-mPD-1: CHO expressed mouse PD-1; CHO: No PD-1 expression. The error bar in the curve is mean ± S.D of MFI from triplicates (b) titration of antibody variants, using percent of inhibition (relative to00% as Pembrolizumab at 20 µg/mL) in the PD-1-PD-L1 blockade assay. The h1340 variants performed equivalently to Pembrolizumab and Nivolumab in terms of maximum inhibition and IC50. The negative isotype control (NIST) showed no PD-1 binding and blocking as expected.
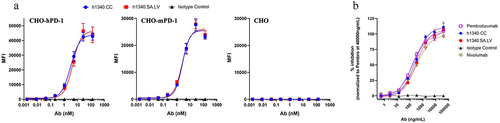
Table 2. Physicochemical property analysis of h1340.CC and h1340.SA.LV. Property changes after storage at 30°C for month are measured by size exclusion chromatography (SEC) and ion exchange chromatography (IEC). HMWF: high molecular weight forms. LMWF : low molecular weight forms.
Table 3. Residue co-frequencies for top 35a-50 pairs in ProteinMPNN designs of the heavy chain of h1340.H1340. The residue co-frequency for the 35a-50 residue pair was analyzed for one hundred h1340 heavy chain sequence designs generated by ProteinMPNN.
Table 4. Top h1340 heavy chain mutations from structure- and ML-guided analysis. The frequencies for selected mutations occurring within sequences containing an SA, AA or VA substitution at the non-canonical disulfide pair are shown and color-coded from light to dark green, according to the frequency at which they occur. A structural rationale as to why these mutations may improve hPD-1 affinity and were chosen as top candidates is provided. The numbering of the position follows the kabat numbering system.
Table 5. Relative affinities for h1340.CC variants selected by structure- and ML-guided engineering. KD (variant)/KD (h1340.CC) indicates the fold change in binding affinity relative to h1340.CC. Sequence differences in variants compared to h1340.SA are highlighted in orange. The non-canonical disulfide bond is labeled in red. Single mutants with improved affinity compared to h1340.SA are highlighted in green, and the best combinatorial mutant in the SA or AA backbone is highlighted in blue and yellow, respectively. The numbering of each residue position follows the kabat numbering system. The relative KD values were determined at 25°C.
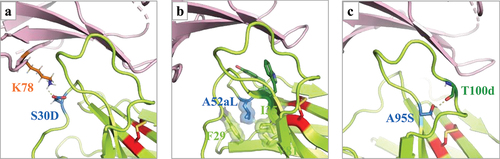
Figure 6. Structural analysis of structure- and ML- guided top mutations. Close-up view of key structural context rationalizing the improved affinity observed for the top 3 ProteinMPNN-generated mutations. Point mutations were generated using the h1340.CC – hPD-1 structure as a template and energy-minimized using the rosetta software suite. (a) Mutation S30D creates a strong hydrogen bond with the conserved PD-1 residue K78. (b) Mutation A52aL provides improved packing of the hydrophobic core supporting key CDRH1 residue W34 and CDRH2 Y52 residues that interact with PD-1. (c) Mutation A95S creates a hydrogen bond with the carbonyl backbone of residue T100d, thereby locking the CDRH3 loop conformation.