Figures & data
Figure 1. (a) The number (cumulative frequency) of approved monoclonal antibodies and their biosimilars increased over the last decades. (b) The charge variant profile is a critical quality attribute (i.e., potentially affecting the safety and efficacy profile) evaluated for molecular characterization and monitored to evaluate identity and purity of mAb – based medicinal products along their lifecycle. A list of different analytical methods currently used to analyze charge heterogeneity is reported.
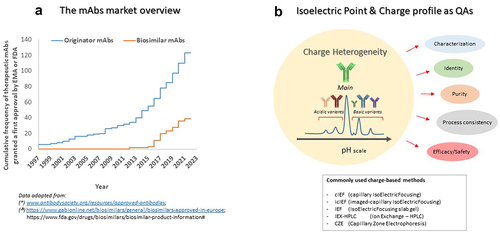
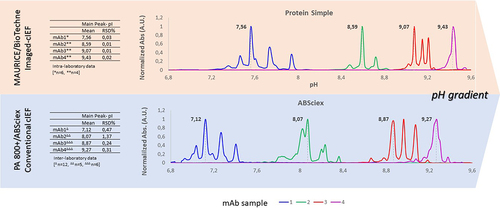
Figure 2. Systematic inconsistencies for measured pI values and charge heterogeneity profiles have been observed in conventional vs imaged cIEF, for a panel of different mAbs, spanning a range between pH 6.8–10. The same panel of therapeutic mAbs was analyzed under comparable experimental conditions with two different devices: PA800±AB (cIEF, sciex) and Maurice™-(icIEF, Biotechne/Protein simple). The electropherograms of four representative mAbs (here numbered from 1 to 4) obtained on the two systems according to the respective calibration curves, were scaled on the same pH range reporting normalized absorbance signal versus pI, to make the results comparable, on the same Y-scale interval. In the table on the left, the averages of the main peak pI values from both systems together with the associated RDS% are also shown. The data presented were obtained from four European Official Medicines Control Laboratory sites, three of which were equipped with conventional cIEF and one with icIEF.