Figures & data
Figure 1. Filtering AbDb files. Starting from the bottom, we eliminate structures with resolution worse than 2.8Å and retain antibodies (Abs) that have both heavy and light variable domains, then eliminate files with missing residues in any of the six CDRs, where the Cα atom B-factor is missing (i.e. 0) or > 80, or a cis non-proline residue is present in an unbound antibody, leading to 364 Abs with 1109 entries. We then retained antibodies with both unbound and bound structures (181 Abs with 773 entries) and performed global and local fitting. Finally, we eliminated unbound/bound structure pairs whose framework region showed ≥1.0Å global Cα RMSD to minimize the impact of the framework region on CDR conformational change and followed by rechecking that both unbound and bound structures are available for an antibody, which led to the elimination of four antibodies. This led to a final set of 749 entries representing 177 antibodies. See supplementary file Supp01_unbound_and_bound_abs.xlsx for the initial dataset of entries with both bound and unbound structures from AbDb. See supplementary file Supp04_antibody_filtering.xlsx for information on entries retained and rejected at each step.
Figure 2. Filtering AbDb unbound structures. Filtering steps for unbound antibody structures uses the same protocol as in . The numbers of entries and antibodies retained at each step are indicated. See supplementary file Supp05_unbound_filtering.xlsx for information on entries retained and rejected at each step.
Figure 3. Conformational change types. The two major canonical clusters (i.e. sub-graphs) of the LRC group ‘H2–10-allT’ are shown and are denoted as c1 and c2 (area shaded in gray). Each canonical cluster consists of AP clusters (i.e., nodes in blue and orange). The AP cluster of the unbound conformer is labeled as au, and its canonical cluster is denoted as cu, in this case, c1. The AP cluster and canonical cluster of a bound conformation x are denoted as aB and cB on the graph. Comparing aB,cB with au,cu, we can define four types of CDR conformational change upon binding: (1) identical AP cluster: the bound conformer is merged with the same AP cluster as the unbound. (2) AP-cluster shift: the bound conformer is merged with a different AP cluster in the same canonical cluster as the unbound. (3) canonical-cluster shift: the bound conformer is merged with an AP cluster in a canonical cluster different from the unbound; (4) non-canonical conformation: x is not merged with any AP cluster or canonical cluster. See Table 1.
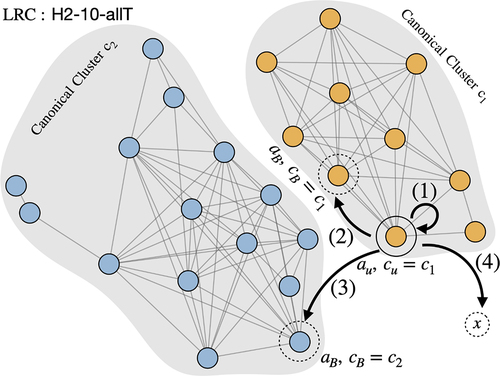
Table 1. Types of conformational change upon binding.
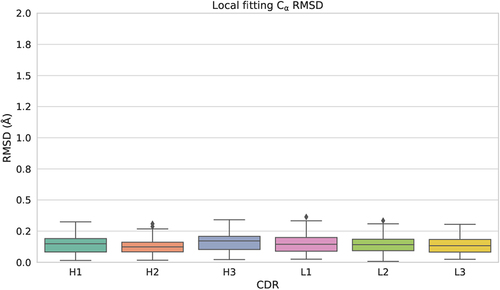
Figure 4. CDR conformational change distribution from global and local fitting. Distributions of conformational change (measured as Cα RMSD) from global fitting and local fitting. Each box represents the first quartile, median and the third quartile while the whiskers represent the lower and upper fence (Q3 + 1.5×IQR meaning 3rd quartile plus one and half inter-quartile range). Outliers are shown as circles above the upper fence. To assist comparison, the Cα RMSD at 0.5Å and 1.0Å are plotted as dashed lines. A p-value to compare local and global fitting was calculated using a two-sample Mann-Whitney U test. In all cases, **** indicates p ≤0.0001 indicating that global and local fitting are significantly different for all CDRs.
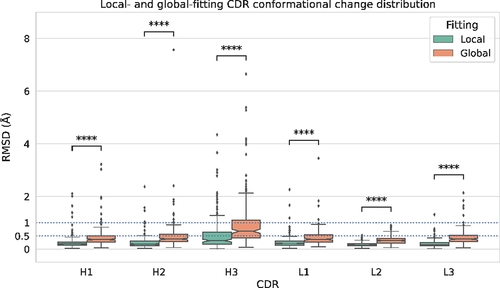
Table 2. Numbers of antibodies in different Cα RMSD ranges.
Table 3. Summary of global and local Cα fitting for non-CDR-H3 loops and CDR-H3 loops.
Figure 5. CDR loop movement upon complexation against loop length. The global Cα RMSD of each CDR upon binding (Cα RMSD) versus loop length (number of residues) are plotted as boxplots, with outliers (exceeding upper fence values Q3 + 1.5×IQR) shown as circles. A horizontal dashed line is drawn at 1.0Å Cα RMSD on each box plot. The number of CDR loops of each loop length are also plotted as histograms.
Figure 6. LRC groups. Each subplot shows the number of entries in each LRC group. For CDR-H3, only groups with more than 10 entries are shown.
Figure 7. Structure clusters of predominant non-CDR-H3 CDR LRC groups. Subplot titles are CDR LRC group names, and the percentage given in parenthesis denotes the ratio of the group size (number of AbDb entries) to the entire set (1091 entries). Each node represents an AP cluster which consists of a set of similar CDR structures and from which a representative structure (also called an exemplar structure) was identified. The edges between pairs of nodes indicate the exemplar structures of both nodes are similar following our criteria under Cartesian space and thus belong to the same canonical cluster. Nodes, directly or indirectly connected, are given the same color. The major groups are colored in black and smaller ones in gray. Note we use edges to indicate connectivity only, which means the distance between a pair of nodes is trivial in this case. The placing of nodes in the figure is purely illustrative.
Table 4. Counts of antibodies of each conformational change type.
Figure 8. Local Cα RMSD of antibodies of each conformational change type. Each subplot is a kernel density estimation of the local Cα RMSD of unbound/bound CDR conformation pairs found in each conformational change type. The number in each subplot parenthesis indicates number of antibodies.
Figure 9. Example of each conformational change type. The figure shows one locally fitted CDR-H3 unbound/bound pair for each conformational change type. The bound CDR-H3 loop is colored black and the unbound loop is gray. (a) Non-canonical cluster conformation: unbound (6umh_0) and bound (6umg_0P), global Cα RMSD of 8.41Å; (b) Canonical-cluster shift: unbound (7n3g_0) and bound (7n3i_0P), global Cα RMSD of 5.28Å; (c) AP-cluster shift: unbound (1kcv_0) and bound (1kcs_0P), global Cα RMSD of 2.38Å; (d) and (e) identical-AP cluster — (d) is locally fitted and (e) is globally fitted to show the loop ‘flapping’ effect. (d) global Cα RMSD 2.27Å, (e) global Cα RMSD 0.54Å.
Figure 10. Impact of antigen mutations on CDR conformation. CDRs within clusters of identical antibodies binding to multiple antigens were locally fitted with one another and the Cα RMSDs were plotted. Where, within this set, there was more than one example of the same antibody binding to the same antigen, an exemplar was selected.