Figures & data
Figure 1. In vitro characterization of BF-588-DualCAB. (a) Schematic overview of the structure. BF-588-DualCAB is based on a regular humanIgg1 antibody specific for EpCAM. At the C-terminus of each lightchain a CD3ε-specific scFv is fused via a short linker (red line).Line). The molecule has two binding sites for EpCAM and two for CD3ε. (b) pHrange ELISA. Binding to both, EpCAM and CD3, was determined by sandwich ELISA at different pH values as indicated on the graph. Antibodies were captured with CD3 immobilized on the plate and incubated with EpCAM-mouse fc. Bound proteins were detected with anti-mouse antibody-HRP conjugate. Binding of BF-588-MonoCAB andBF-588-DualCAB is highest at pH6.0 and drops with increased pH. ThepH inflection point (50% signal compared to pH6.0, which was set as100%) for BF-588-MonoCAB and DualCAB were determined by GraphPadPrism software. The signal for BF-588-WT is not pH-dependent. x-axis,pH of the ELISA buffers; y-axis, optical density (OD) at 450 nm. (c) pHaffinity ELISA. Binding to both, EpCAM and CD3, was determined by sandwich ELISA with a serial of antibody concentrations as indicated on the graph. Antibodies were captured with CD3 immobilized on the plate and incubated with EpCAM-mouse fc. The bound proteins were detected with anti-mouse antibody-HRP conjugate. The EC50values of BF-588-MonoCAB, BF-588-DualCAB and BF-588-WT at pH6.0 or pH7.4 were determined using the GraphPad prism software. BF-588-WT, red lines; BF-588-MonoCAB, blue lines; BF-588-DualCAB, green lines; pH6.0: solid line; pH7.4: dashed line. x-axis, antibody concentration (log nanomolar); y-axis, OD 450 nm. (d) Potency of BF-588-WT, BF-588-MonoCAB, and BF-588-DualCAB in pH affinity ELISA of Human EpCAM and CD3 at pH6.0 and pH7.4.EC50, half-maximal effective concentration.
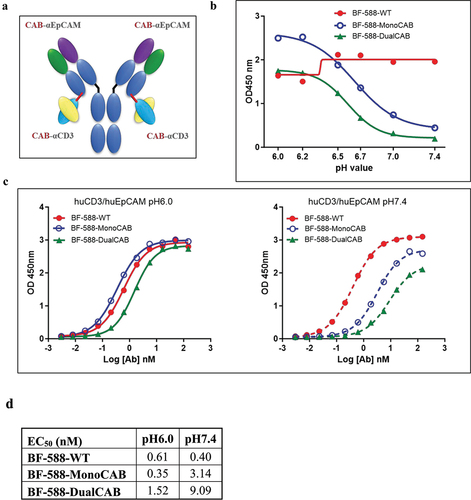
Figure 2. Binding kinetics of clone BF-588-DualCAB to human EpCAM (left) or human CD3 (right) at pH6.0 (top), pH6.5 (middle) and pH7.4 (bottom). Shown are the SPR sensorgrams of one representative experiment at each pH. The binding to human EpCAM is similar at pH6.0 and pH6.5 (1.3 nM and 1.22 nM, respectively), but drops to 6.7 nM at pH7.4. In addition, the SPR signal drops from ~ 100 RU at pH6.0 to ~ 30 RU at pH7.4. The binding affinity to human CD3 drops from 8.1 nM at pH6.0 to 9.1 nM at pH6.5 and 35 nM at pH7.4. In addition, the SPR signal drops from ~ 100 RU at pH6.0 to ~ 20 RU at pH7.4. X axis, Time [s]; Y axis, response units [RU]. (a) Binding kinetics of clone BF-588-DualCAB to human EpCAM (left) or human CD3(right) at pH6.0 (top), pH6.5 (middle) and pH7.4 (bottom). Shown are the SPR sensorgrams of one representative experiment at each pH. The binding to human EpCAM is similar at pH6.0 and pH6.5 (1.3 nM and 1.22 nM, respectively), but drops to 6.7 nM at pH7.4. In addition, the SPRsignal drops from ~ 100 RU at pH6.0 to ~ 30 RU at pH7.4. The binding affinity to human CD3 drops from 8.1 nM at pH6.0 to 9.1 nM at pH6.5 and 35 nM at pH7.4. In addition, the SPR signal drops from ~ 100 RU at pH6.0 to ~ 20 RU at pH7.4. X axis, Time [s]; Y axis, response Units[RU]. (b) Measured binding affinities of clone BF-588-DualCAB to human and cynomolgusEpCAM and CD3 at pH6.0, pH6.5, and pH7.4 (average of three experiments).
![Figure 2. Binding kinetics of clone BF-588-DualCAB to human EpCAM (left) or human CD3 (right) at pH6.0 (top), pH6.5 (middle) and pH7.4 (bottom). Shown are the SPR sensorgrams of one representative experiment at each pH. The binding to human EpCAM is similar at pH6.0 and pH6.5 (1.3 nM and 1.22 nM, respectively), but drops to 6.7 nM at pH7.4. In addition, the SPR signal drops from ~ 100 RU at pH6.0 to ~ 30 RU at pH7.4. The binding affinity to human CD3 drops from 8.1 nM at pH6.0 to 9.1 nM at pH6.5 and 35 nM at pH7.4. In addition, the SPR signal drops from ~ 100 RU at pH6.0 to ~ 20 RU at pH7.4. X axis, Time [s]; Y axis, response units [RU]. (a) Binding kinetics of clone BF-588-DualCAB to human EpCAM (left) or human CD3(right) at pH6.0 (top), pH6.5 (middle) and pH7.4 (bottom). Shown are the SPR sensorgrams of one representative experiment at each pH. The binding to human EpCAM is similar at pH6.0 and pH6.5 (1.3 nM and 1.22 nM, respectively), but drops to 6.7 nM at pH7.4. In addition, the SPRsignal drops from ~ 100 RU at pH6.0 to ~ 30 RU at pH7.4. The binding affinity to human CD3 drops from 8.1 nM at pH6.0 to 9.1 nM at pH6.5 and 35 nM at pH7.4. In addition, the SPR signal drops from ~ 100 RU at pH6.0 to ~ 20 RU at pH7.4. X axis, Time [s]; Y axis, response Units[RU]. (b) Measured binding affinities of clone BF-588-DualCAB to human and cynomolgusEpCAM and CD3 at pH6.0, pH6.5, and pH7.4 (average of three experiments).](/cms/asset/04ea64ec-8bd4-460f-8b8a-661de36411ab/kmab_a_2322562_f0002_oc.jpg)
Figure 3. In vitro functional characterization of BF-588-DualCAB. Target-dependentT-cell activation and cytotoxicity of EpCAM-expressing cells. EpCAM × CD3-based bispecific antibodies induce in vitro activation ofT cells in the presence of EpCAM-expressing target cells. (a) Jurkat/NFAT/NFAT-luc reporter cells were incubated with human EpCAM-expressing cells and serial dilutions of BF-588-WT (red curve), BF-588-MonoCAB (bluecurve) and BF-588-DualCAB (green curve) bispecific antibodies at pH6.0 and pH7.4. Isotype control shown in black. HCT116: human colorectal cancer cell line; CHO-huEpCAM: CHO cells stably expressinghuEpCAM antigen. x-axis, log antibody concentration in picomolar(pM); y-axis, relative luciferase units (RLU).
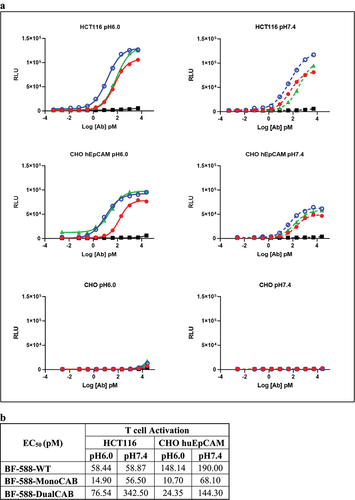
Figure 3. (b) Potency of BF-588-WT, BF-588-MonoCAB and BF-588-DualCAB in mediating T cell activation when cocultured with HCT116 and CHO-huEpCAM cells at pH6.5 and pH7.4. EC50, half-maximal effective concentration in picomolar (pM). (c) Effector PBMCs,PBMCs, E:T ratio 5:1, were co-cultured with HCT116 cells and treated with serially diluted BF-588-DualCAB or BF-588-WT antibodies for 80 hours. Co-cultures were incubated in culture media under TME (pH6.5) or physiological (pH7.4) conditions. Cytolysis was monitored in real time using Agilent x Celligence real time cell analysis technology(RTCA). The rate of target cell cytolysis was calculated by referencing the target cell growth without treatment. x-axis, Logantibody concentration in picomolar (pM); y-axis, % of Cytolysis. (d) Potency of BF-588-DualCAB and BF-588-WT in inducing cytotoxicity of HCT116 cells by human PBMCs at pH6.5 and pH7.4.EC50, half-maximal effective concentration. pM, picomolar. BF-588-WT: red lines; BF-588-MonoCAB: blue lines; BF-588-DualCAB: green lines; pH6.0 or pH6.5: solid line; pH7.4: dashed line.
Figure 4. Invivoefficacy of EpCAM T-cell engagers. EpCAM× CD3 bispecific antibodies promote anti-tumor immunity in a cell line-derived xenograft humanized mouse model of human colorectal and breast cancers. (a-c) HCT116 human colon carcinoma was implanted in NOG mice. huPbmcs were inoculated intraperitoneally 2 hours after tumor inoculation. Animals were randomized to treatment groups when tumor volume reached approximately 130 mm3. Following randomization, animals were dosed i.V. With isotype x CD3WT control antibody or BF-588-WT (A), BF-588-MonoCAB (B) and BF-588-DualCAB (C) at 1mpk twice per week for four weeks. (d) NCGmice were implanted with estrogen pellets on day 0. On day one animals were implanted with a mixture of BT474 cells and huPbmcs(1:1) subcutaneously in PBS-Matrigel at the right mammary fat pad. Animals were randomized, and treatment was initiated when tumor volume was approximately 95 mm3.Mice were administered i.V. With BF-588-DualCAB or isotype x WT CD3 control bispecific antibodies at 0.5 mpk twice per week for four weeks. mpk: milligram per kilogram. x-axis:Days after treatment; y-axis mean tumor volume ± SEM. BF-588-WT:red line; BF-588-MonoCAB: blue line; BF-588-DualCAB: green line.
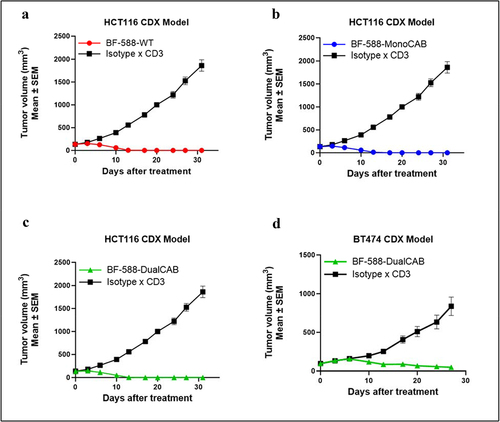
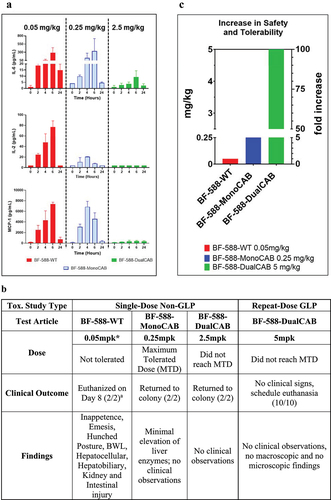
Figure 5. Cytokine release and tolerability of EpCAM x CD3 bispecific antibodies in cynomolgus monkeys. Cytokinerelease and tolerability of EpCAM × CD3 bispecific antibodies in a single- and repeat-dose toxicity study in cynomolgus monkeys. Clinical outcomes of the maximum tolerated or maximum tested doses of BF-588-WT, BF-588-MonoCAB, and BF-588-DualCAB in a single-dose non-GLP toxicity study in cynomolgus monkeys and of the maximum tested dose of BF-588-DualCAB in a repeat-dose GLP toxicity study in cynomolgus monkeys. (a) Cytokine release in cynomolgus monkeys treated with a single dose of BF-588-WT (0.05 mpk, red bars), BF-588-MonoCAB (0.25 mpk = MTD, blue bars) or BF-588-DualCAB (2.5 mgk= max. dose tested, green bars). Cytokine concentration in the monkey serum was measured 0–24 hours after treatment as indicated.IL-2: Interleukin-2; IL-6: interleukin-6 and MCP-1: monocyte chemoattractant protein-1.X-axis: time after dosing in hours; y-axis: cytokine concentration in pg/mL. (b) Summaryof EpCAM x CD3 bispecific antibodies-related toxicity and clinical outcome. Major clinical findings in cynomolgus monkeys treated with the maximum tolerated dose or maximum dose of BF-588-WT,BF-588-MonoCAB and BF-588-DualCAB in a single-dose toxicity study and in a 1-month repeat-dose once-weekly dosing (five doses total) of BF-588-DualCAB in cynomolgus monkeys. (c) Increase in tolerability of CAB EpCAM T-cell engagers in cynomolgus monkeys. BF-588-WT was not tolerated at 0.05 mpk (only dose tested). The MTD for BF-588-MonoCAB was determined to be 0.25 mpk. (5-fold improvement over the wild type). BF-588-DualCAB clone was very well-tolerated at 5 mpk and the MTD was not reached, indicating another ≥ 20-fold improvement over the MonoCAB and ≥ 100-fold improvement over the wild type EpCAM x CD3 TCE. x-axis: dose in mg/kg; y-axis: EpCAM x CD3bispecific antibodies. BF-588-WT, red bars; BF-588-MonoCAB, blue bars; BF-588-DualCAB, green bars. Abbreviations: MTD, maximum tolerated dose; MPK, milligrams per kilogram; BWL, bodyweight loss. a– number of animals.