Figures & data
Figure 1. Schematic representation of the reaction scheme in the vascular and interstitial spaces of all organs of the body. Target receptor (brown structure) exists in surface-bound and soluble forms. Receptor shedding (kshed) is denoted by the black arrows. Internalization of receptor is denoted by the red arrows (kint). We assume that kshed and kint are not affected by mAb binding.
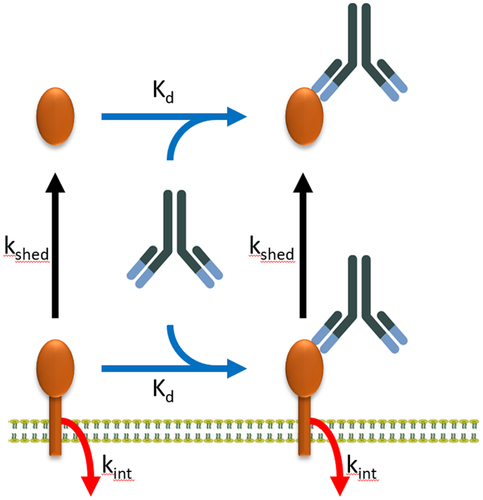
Figure 2. Fitted sigmoidal function (solid red line) describes the correlation between liver membrane protein concentrations expressed in molar and ppm units. Circles represent the observed data. Solid red lines and the shaded area represent the predicted median liver concentrations and the corresponding 90% prediction confidence interval.
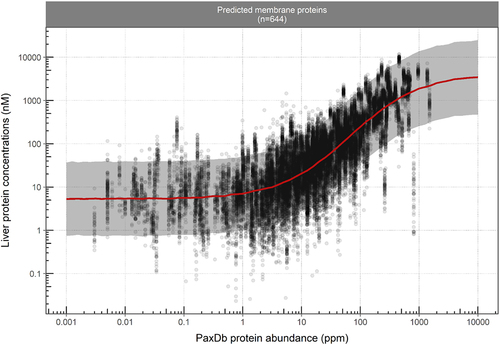
Table 1. The sigmoidal function parameter estimates that describe the correlation between the molar and ppm concentrations for liver membrane proteins.
Figure 3. The predictive performance of the sigmoidal correlation function for the validation data sets. Circles represent the observed data. Solid red lines and the shaded area represent the predicted median liver concentrations and the corresponding 90% prediction confidence interval.
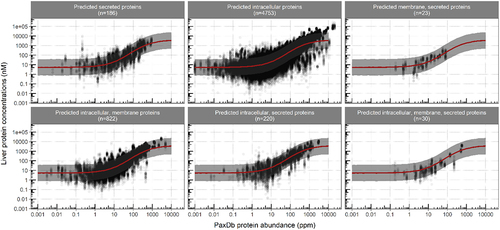
Table 2. The calculated tissue concentrations of EGFR and HER2 and their allocation to interstitial and vascular spaces for alternative PBPK modeling purposes. Numbers between parentheses represent the 90% prediction interval. tRorgan denotes the average tissue concentration of the target. mRint,organ and mRint+vas,organ denote target concentrations for the cases where the location for membrane-bound target is assigned to interstitial space only or was split equally between organ interstitial and vascular compartments, respectively.
Table 3. PBPK model parameter estimates for EGFR (A) and HER2 (B). Fr_tot denotes the tissue concentration dimensionless adjustment factor, which accommodates the deviation from the tissue concentration model prediction calculated from EquationEquation 1(1)
(1) , while kint denotes the internalization rate constant. kshed denotes the shedding rate constant for the membrane-bound target and RL is the relative likelihood of the given model vs one with the lowest AIC within a group.
Figure 4. EGFR and HER2 PBPK model parameter fitting. a-b) cetuximab IV dosing at 50 (beige), 100 (purple), 250 (green), 400 (red) and 500 mg/m2 (blue).Citation22 solid line: internalization rate constant kint and target concentrations are adjusted, dashed line: only kint is adjusted. A: membrane EGFR is allocated to organ interstitium only, B: membrane EGFR is allocated to organ vascular and interstitial spaces at equal concentrations. c-d) trastuzumab IV dosing at 1 (purple), 2 (green), 4 (red) and 8 (blue) mg/kg.Citation21 solid line: internalization rate constant kint and target concentrations are adjusted, dashed line: only kint is adjusted. C: membrane HER2 is allocated to organ interstitium only, D: membrane HER2 is allocated to organ vascular and interstitial spaces at equal concentrations.
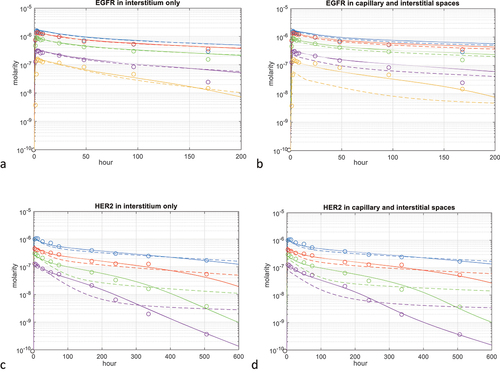
Figure 5. Simulated time course values for a single IV dose of a mAb. Total drug (red) and total target (green) are denoted by solid lines. Dashed lines indicate free drug (red), free soluble target (green) and complex of the two (blue). a) 500 mg/m2 cetuximab interacting with soluble EGFR and b) 8 mg/kg trastuzumab interacting with soluble HER2.
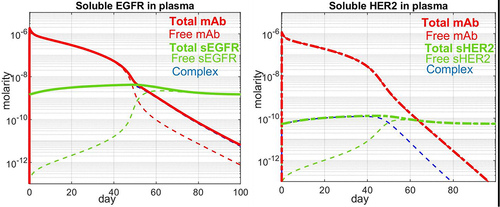
Figure 6. Predicted time course values for interstitial free drug (red), free membrane-bound target (green) and the complex of the two (blue). a) membrane EGFR in liver interstitium after a 500 mg/m2 IV dose of cetuximab, b) membrane EGFR in tumor interstitium after a 500 mg/m2 IV dose of cetuximab, c) membrane HER2 in liver interstitium after an 8 mg/kg IV dose of trastuzumab, d) membrane HER2 in tumor interstitium after an 8 mg/kg IV dose of trastuzumab.
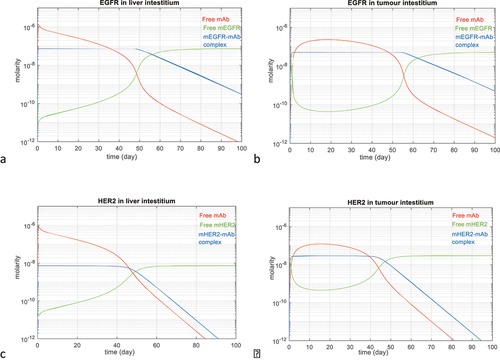
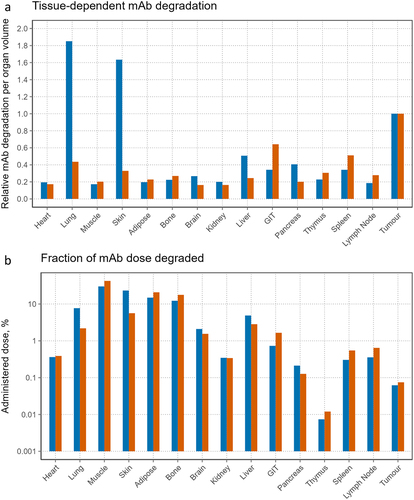
Figure 7. Organ-dependent degradation of the dosed mAbs in the PBPK model: blue-cetuximab, orange-trastuzumab. a) relative degradation of dosed mAbs per organ volume unit, b) fraction of administered dose degraded in different tissues of the body.