Figures & data
Figure 1. The effects of immunogenicity on antibody-based therapeutics. (A) The structural diagrams of different antibody-based therapeutics. mAb, monoclonal antibodies. KIH, knob-into-hole. BiTE, bispecific T cell engagers. ADC, antibody-drug conjugate. Fv, variable fragment. (B) The impacts on antibody-based therapeutics. The ADA bound to the paratope of mAb elicit neutralization capacity and therefore lead to the attenuation of therapeutic efficacy. The ADA may also trigger the onset of type I (IgE-mediated) and II (IgG-mediated) hypersensitivity. Once immunocomplexes are formed by ADAs (IgM or IgG) and therapeutics, the adverse events associated with type III hypersensitivity may take place. The large sizes of immunocomplexes also lead to faster clearance of therapeutics from blood stream. The graph was created on BioRender.com.
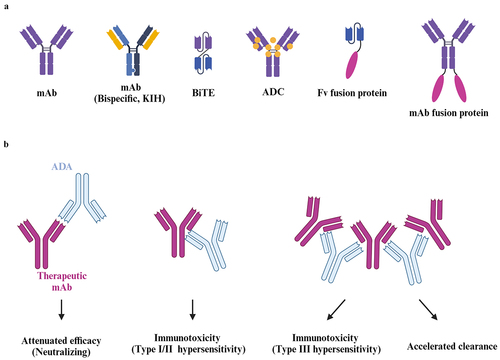
Figure 2. The schematic illustration of T cell-dependent and -independent B cell activation pathways. DC, dendritic cell. pMHC II, peptide-MHC II complex. TCR, T cell receptor. BCR, B cell receptor. The graph was created on BioRender.com.
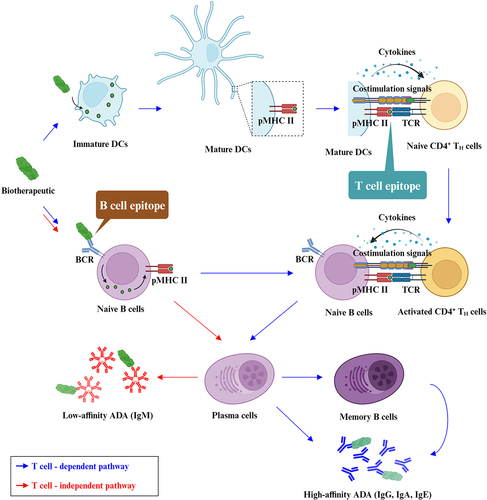
Table 1. Summarization and comparison of various strategies applied for TCE identification.
Table 2. The summary and comparison of various strategies applied for pBCEs identification.
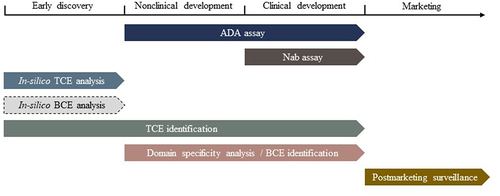
Figure 3. The recommended schedule of actions to be conducted for immunogenicity assessment of TPs. Different computational and experimental strategies can be performed to support the investigation of immunogenicity from early discovery to marketing stages. Note: the in silico BCE analysis is outlined in dashed line due to the lack of solid evidence justifying its value in candidate evaluation.