
Figures & data
Figure 1. Mechanism of asparagine deamidation and aspartate isomerization through an aspartyl-succinimide intermediate. The R group represents the side chain of the subsequent amino acid relative to the reference asparagine/aspartic acid.
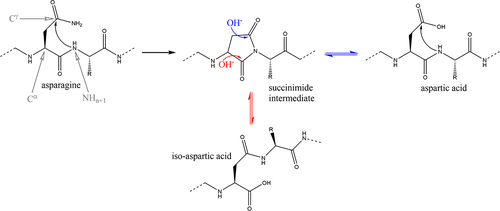
Table 1. Selection of eight molecular descriptors used for the prediction of deamidation and isomerization in the CDRs of antibodies.
Figure 2. Correlation matrices of the degradation rate and the descriptors obtained in a preliminary screening. The screening involved sampling 50 conformations using low-mode MD at pH 6. The Pearson’s correlation coefficient multiplied by 100 is shown. The matrices show the correlation of the binary degradation rate (binary deg.rate) and the descriptors from (a) 260 Asn motifs and (b) 192 Asp motifs.
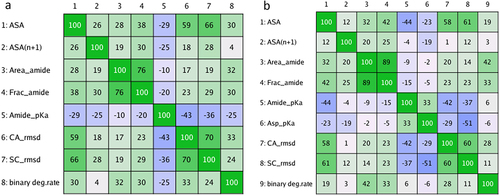
Table 2. Overview of molecular descriptor combinations for predicting chemical degradation.
Table 3. Metrics for models predicting Asn degradation in validation set. The letters A, B and C refer to the different sets of predictors. ‘A’ represents the SASA-group (including ASA and ASA(n + 1)), ‘B’ denotes the Static-group (including ASA, ASA(n + 1), Amide_pka, and Area_amide), and ‘C’ refers to the Dynamic-group (including ASA, SC_rmsd, Ca_rmsd, and Amide_pKa). The sequence-based approach classifies NG and NS as the only two motifs susceptible to degradation.10
Table 4. Metrics for models predicting Asp degradation in validation set. The letters A, B and C correspond to different sets of predictors. ‘A’ represents the SASA-group (including ASA and ASA(n + 1)), ‘B’ denotes the Static-group (including ASA, ASA(n + 1), Amide_pka, Asp_pka and Area_amide), and ‘C’ refers to the Dynamic-group (including ASA, SC_rmsd, Ca_rmsd, and Amide_pKa). The sequence-based approach classifies DG and DS as the only two motifs susceptible to degradation.Citation10.
Figure 3. Comparison of QSAR models predicting Asn and Asp degradation in validation set. The models were generated using different sampling techniques and predictor sets: energy-minimized homology models (hom), conformational ensembles obtained by Low-ModeMD at pH 6 with 50 (L50) or 400 (L400) structures, conformational ensemble obtained by the stochastic titration protocol (ST-pH6),Citation39 and sampling within 200 ns of classical molecular dynamics simulation. In addition to pH 6.0, the ST protocol was also applied at pH 5.5 and pH 8.5 (ST-stress). The classification threshold of the best ST-model was further reduced to 0.3 (ST-thres03). The predictor sets are categorized into three groups. Suffix A: SASA-group, suffix B: static-group, suffix C: dynamic-group. The sequence-based approach classifies all Asx residues with a subsequent glycine or serine as liable.Citation10 The error bar shows the standard error of the metrics from 15-fold cross validation.
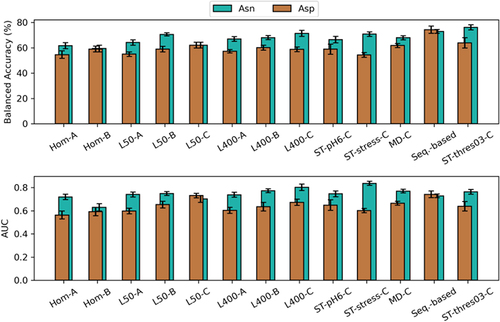
Figure 4. Accuracy metric of the model built from the Dynamic-group and sampling with ST-protocol at (a) pH 8.5 for Asn and (b) pH 6 for Asp in validation set (TNR: true negative rate, probability that an actual stable motif will test negative in the model; TPR: true positive rate, probability that an actual degraded motif will test positive in the model). The prediction probability from the QSAR model was converted to a binary classification using five different thresholds. The error bar shows the standard error of the metrics from 15-fold cross validation.
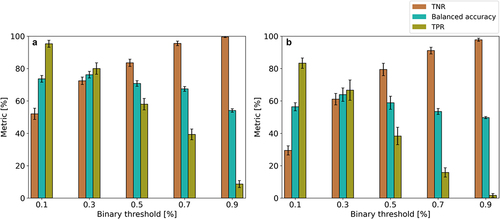
Figure 5. Correlation matrices of the descriptors obtained by applying stochastic titration at pH 6 and 8.5 for Asn and Asp, respectively. The Pearson’s correlation coefficient multiplied by 100 is shown. (a) Correlation between descriptors from 260 Asn motifs. (b) Correlation between descriptors from 192 Asp motifs. The QSAR model was built with the Dynamic-group.
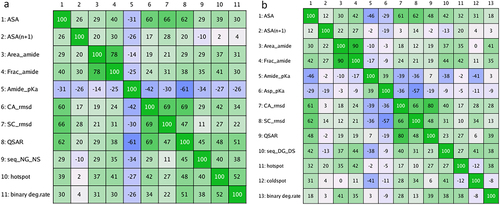
Figure 6. Decision tree for evaluating reactivity of Asn/Asp motifs. The decision tree uses three branches to assess the reactivity. First, the hot-/coldspot definitions from Lu et al. Citation10 are applied to classify Asx at positions H54, H98 and L30-L30F, as well as DS and DD motifs at position H61. Second, the structure-based QSAR model evaluates whether the motif has a high probability of being stable. If the outcome of the QSAR model exceeds the probability threshold of 0.3, the sequence is then screened for liable motifs (XG and XS).
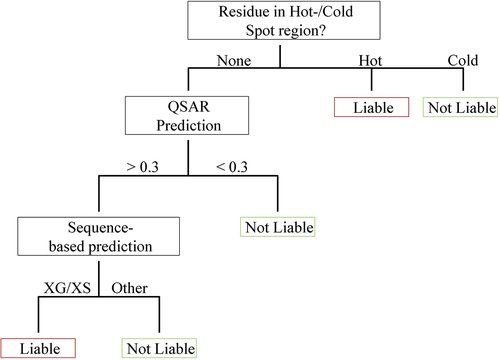
Table 5. Composition of the datasets in terms of population classes.