Figures & data
Figure 1. SEC-UV chromatograms of mAb1 (a) and mAb2 (b) stability samples at T0 and after 3-month incubation at 25°C (“3M25C”). Inserts in panel (a) and (b): enlarged area to display the HMW peaks.
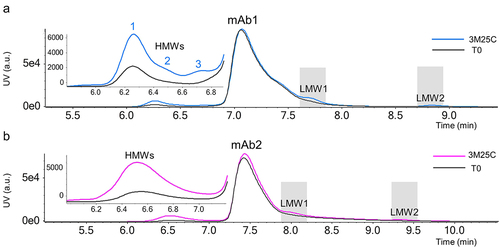
Table 1. Major species detected by SEC-UV-native MS in mAb1 stability samples at T0 and after 3-month incubation at 25°C (“3M25C”).
Table 2. Major species detected by SEC-UV-native MS in mAb2 stability samples at T0 and after 3-month incubation at 25°C (“3M25C”).
Figure 2. Generation of Fab/c fragment to study Fab/c associated aggregation. (A) Limited IgdE enzymatic digestion of mAb1 and mAb2 to generate Fab/c fragments; (b) separation of digests by hydrophobic interaction chromatography; (C) stability study on the collected mAbs and Fab/c fractions from HIC and their mixture followed by SEC-UV-native MS characterization.
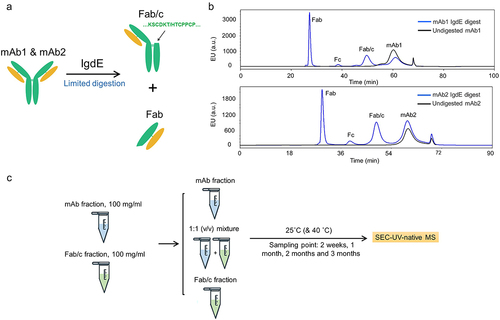
Figure 3. Characterization of three mAb1 stability samples containing Fab/c fragments after a three-month incubation at 25°C by the SEC-UV-native MS method. a) SEC-UV chromatograms of mAb1 fraction, 1:1 mixture and Fab/c fraction at time point of three months (“3M25C”); insert panel: enlarged area to display the HMW peaks; b) mass spectra of HMW peaks, with the deconvoluted masses and the corresponding dimer species shown; the charge states highlighted in blue were used for the construction of XICs and peak area calculation; the charge states highlighted in orange were interference peaks from mAb1 dimer; c) plots of total HMWs in mAb1 fraction, 1:1 mixture and Fab/c fraction based on UV peak area; d) plots of major species in mAb1 fraction, e) 1:1 mixture and f) Fab/c fraction based on UV peak area.
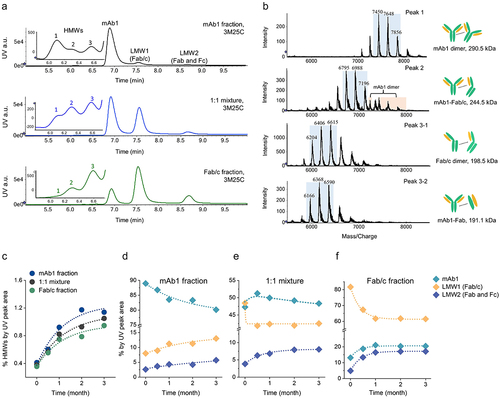
Figure 4. Plots of dimer species formation based on UV peak area in (a) mAb1 fraction, (b) 1:1 mixture and (c) Fab/c fraction. Plots of dimer species formation based on XIC peak area in (d) mAb1 fraction, (e) 1:1 mixture and (f) Fab/c fraction.
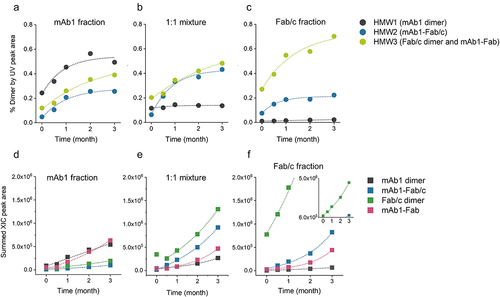
Figure 5. Characterization of three mAb2 stability samples containing Fab/c fragments after three-month incubation at 25°C by the SEC-UV-native MS method. a) SEC chromatograms of mAb2 fraction, 1:1 mixture and Fab/c fraction; insert panel: enlarged area to display the HMW peaks; b) Mass spectra of detected dimer species under the HMW peak; deconvoluted masses and cartoon illustrated identifications are shown on the right side; the charge states labeled and highlighted in blue of each dimer species were used for the construction of XICs and peak area calculation; the charge states highlighted in orange were interference peaks from mAb2 dimer.
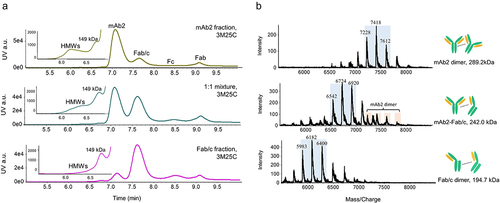
Figure 6. Plots of total dimer species change during 25°C stability incubation for (a) mAb2 fraction, (b) 1:1 mixture and (c) Fab/c fraction based on UV peak area. Plots of formation of each dimer species in (d) mAb2 fraction, (e) 1:1 mixture, and (f) Fab/c fraction based on mass spec XIC peak area.
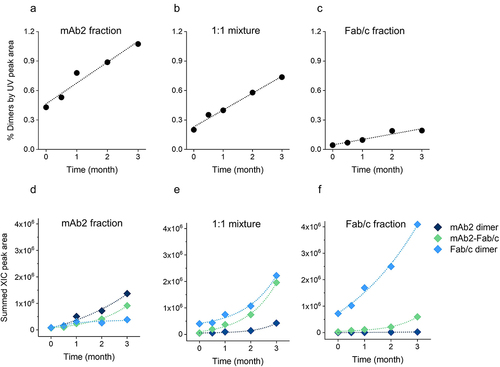
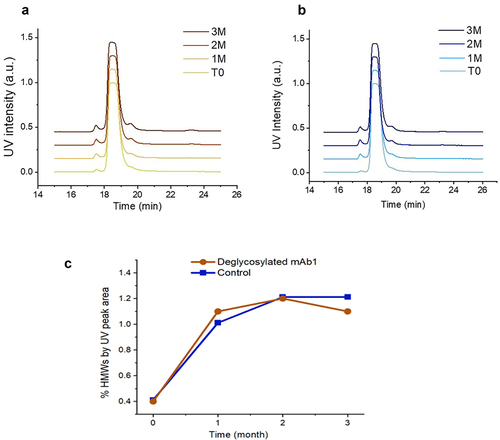
Figure 7. SEC-UV chromatograms of a) deglycosylated mAb1 and b) control sample at T0, one-month (“1 M”), two-months (“2 M”) and three-month (“3 M”) time points of incubation at 25°C. The two post monomer peaks with retention times of approximately 19.5 min and 23.0 min were the fab/c fragment and fab fragment, respectively. C) a plot of %HMWs vs. incubation time (month) based on UV peak areas of deglycosylated mAb1 and control sample.