
Figures & data
Figure 1. SC absorption rate constant overview (1a), across IgG subclasses (1b), and across clearance types (1c). For clarity, the two box plots show the 25%, 50%, and 75% quartiles with jittered points.
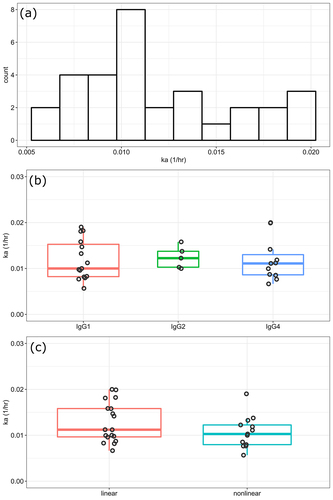
Table 1. Properties used in the predictive models.
Table 2. RMSEs across all the predictive models.
Figure 2. Comparison of the predicted and actual ka values pooled from each cross validation run. The two dotted lines are one standard deviation away from the dashed identity line, and the enclosed area is highlighted in green. Each mAb has 10 runs of corresponding predictions shown as faded, red dots. Their means are shown as blue dots.
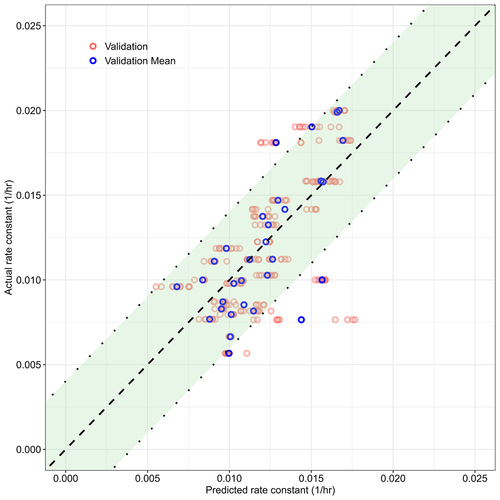
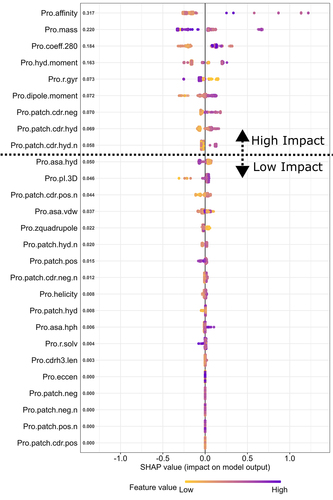
Figure 3. SHAP plot of the XGBoost model. It is a visual representation of how different molecular property values (also customarily called feature values in a SHAP plot) affect ka prediction. Each row of the plot corresponds to a molecular property and is dotted with 310 points (corresponding to 310 runs obtained from 31 mAbs each run 10 times). The range of values for a given molecular property is color coded from purple (relatively high value for a given molecular property) to yellow (relatively low value for a given molecular property). The position of a colored point relative to the centerline shows the impact of a value. If a point lies to the right of the centerline (and thus with a positive SHAP value), it makes the model predict a higher ka relative to an initial guess (starting at the ka average across the 31 mAbs), and vice versa. For example, if yellow points cluster far away to the right of the center line, the interpretation will be that lower values of a given molecular property is likely related to a higher ka. The magnitude of the SHAP values averaged across all data points for each molecular property is listed by the y-axis. Properties with an averaged SHAP value below or equal to 0.05 (unitless as ka is normalized during data preprocessing) are considered unimportant, which, if converted back, is equivalent to the inability to change more than 0.0002 h−1 from an initial guess. Considering that the ka average across the 31 mAbs is two orders of magnitude larger and the smallest ka is still one order of magnitude larger than 0.0002 h−1, we consider it reasonable to exclude any molecular properties with below or equal to a SHAP value of 0.05 as unimportant.
Supplemental Material
Download MS Word (310.6 KB)Supplementary Information
Download MS Excel (104.8 KB)Data availability statement
The datasets for the absorption rate constants and the molecular properties are available in the Supplementary Information.