
Figures & data
Table 1. Statistics of the number of heavy-chain sequences processed to make the AB-NGS database. We stratified our datasets by the organism and whether the sequence was productive (no stop codons, no truncation, see Methods for more details). The multiple repeats within the bioproject were taken as identical variable region sequences on the nucleotide level to increase the stringency of including only the confident sequences.
Figure 1. Annotated C regions as cumulative plot. We automatically identified the constant region, wherever it was possible. On the basis of the heavy C region call, the isotype can be inferred. For most of the sequences it was not possible to infer the C region (the blank leftmost column).
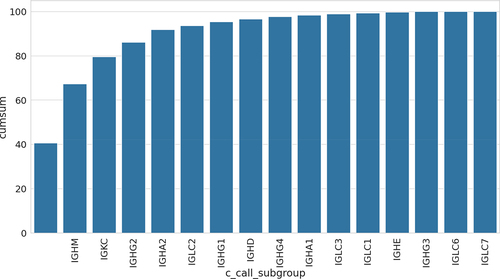
Figure 2. Metadata landscape of our database. a. Author-annotated organism distribution of sequences in our dataset. b. Source of B-cells in our dataset. c. Type of B-cells in our dataset. d. Author-annotated disease present in the dataset.
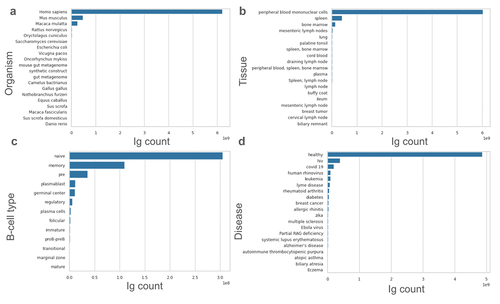
Table 2. Number of public CDR-H3s by the number of independent bioprojects they occurred in. The ‘Confident’ CDR-H3 dataset is a collection of CDR-H3s from sequences that occurred at least once within each bioproject. By contrast the ‘All’ dataset includes all the sequences without such constraints. Within Confident and All datasets, we noted how many separate bioprojects each CDR-H3 occurred in. The table shows the number of CDR-H3s in each dataset with CDR-H3s occurrences equal to or greater than specified bioproject redundancy. The percentages in both columns refer to different totals, in case of All CDR-H3s it is 385,878,857 sequences and in case of Confident 85,688,290.
Figure 3. Length distribution of the CDR-H3s across the entire dataset and public datasets. The solid black line shows the length distribution in the entire dataset of 385 m sequences. The public datasets are divided into the Confident ones (dashed lines, subscript ‘r’ in legend) and the ones not requiring redundancy (solid lines, subscript ‘all’ in legend). The numeric subscripts in public datasets indicate the across bioproject redundancy required, e.g., public_all_3, has all the CDR-H3s that were observed across at least three bioprojects.
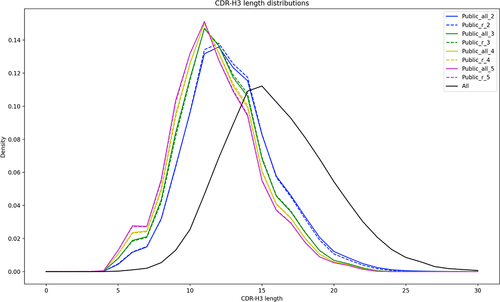
Figure 4. Diversity of the CDR-H3s in the public datasets. Here we show the Confident (redundant) dataset diversity against the background of all the CDR-H3s (‘All’ dataset, black line). Diversity was calculated as amino acid frequency entropy calculated for each position on length-matched CDR-H3s. The entropy is lower in the in the N-terminal region because of higher conservation (e.g., the AR motif). Each panel shows specific CDR-H3 lengths according to the IMGT definition. As expected, downsampling each public dataset to 700 (the number of therapeutic CDR-H3s we have) and recalculating the entropy reduces the diversity further.
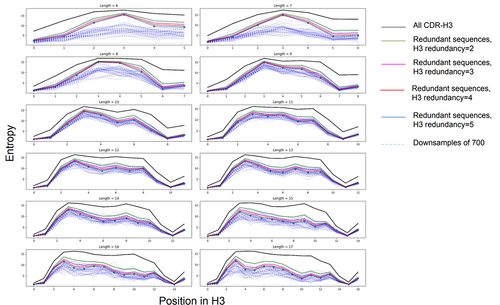
Table 3. Number of therapeutic CDR-H3s within a specific Hamming distance from a dataset. We created a range of reference datasets of CDR-H3s that we compare to the 700 therapeutic CDR-H3s using Hamming distance. As references, we created variants of the Confident and All datasets akin to , where the CDR-H3s were only constrained to those that occurred in a sufficient number of bioprojects (given by bioproject redundancy column). We also created randomizations of each such dataset either by randomizing the CDRs in the NGS dataset (the -D subscript) or the 700 therapeutic CDR-H3s we compared to (−T subscript). For instance, Public All-2 is the subset of CDR-H3s from the ‘All’ dataset, constrained to CDR-H3s occurring in at least two bioprojects and compared to the original unmodified 700 therapeutic CDR-H3s. Random All T-2 is the same dataset, but the 700 therapeutics CDR-H3s are randomized. In Random All D-2, only the original NGS dataset is randomized and therapeutic CDR-H3s are left unmodified. The CDR-H3s are compared by length-matching and hamming distance at five levels, with 0 Hamming distance indicating identity and 4, indicating four differences. Additionally we compared the therapeutic contrast with germline CDR-H3s, in original form from IMGT and applying our randomization scheme to the same germline CDR-H3s.
Table 4. Clonotype-level matches of public H3s to therapeutics. As in , for All and Confident datasets, we constrained them to only those CDR-H3s that occurred in a number of bioprojects specified by the Bioproject redundancy column. The CDR-H3 Hamming distance between a reference and therapeutic is calculated only if their V or V+J calls match between the NGS sequence and a therapeutic sequence.
Data availability statement
The AB-NGS dataset is available for nonprofit organizations for noncommercial use via following instructions on our site: https://naturalantibody.com/ngs/.