
Figures & data
Figure 1. (a) Triangulated solvent-excluded molecular surface of a Fab MOE structure model, generated using Nanoshaper.Citation49 (b) Grid-based electrostatic potential from APBS mapped onto the triangulated surface. The potential values are assigned to atoms, and the sum is assigned to corresponding residues. (c) Hydrophobicity values assigned to each vertex on the triangulated surface based on residue-level hydrophobicity scales. The values on each vertex are re-assigned by averaging hydrophobicity values from neighboring vertices within a cutoff distance of 10. The largest hydrophobic patch could be on the variable domain (WW and BM) or the elbow (KD and EI), depending on the hydrophobicity scale.
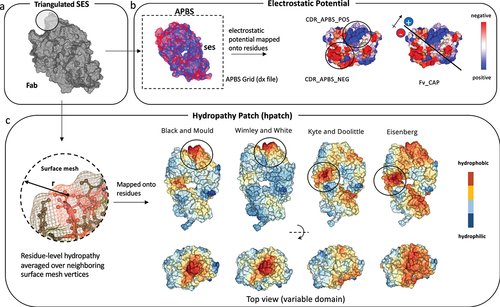
Figure 2. (a) Performance of CDR_APBS_neg calculated at pH 6 in predicting the viscosity data from Apgar et al. (PDGF38)Citation62 (b-c) Classification (precision–recall curve), Spearman rho (ρ), and Pearson R2 correlations with viscosity data for the absolute value of CDR_APBS_neg, the additive inverse of Fv_CAP, and previous methods: SCMCitation32 (absolute value) and PfAbNet-viscosity.Citation62 (d-f) Performance of HPATCH, TAP’s CDR.PSH,Citation28 and SAPCitation39 in predicting the viscosity data from Dai et al.Citation63 using the same accuracy metrics as A-C.
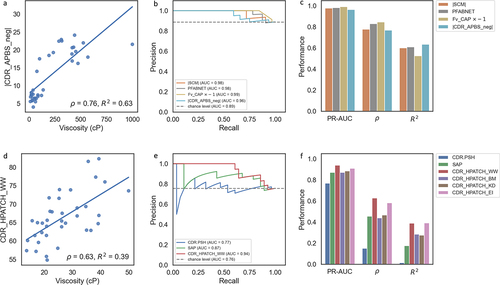
Figure 3. (a) Table comparing performance of CDR_APBS_pos at pH 7.4 (current work), Fv Charge at pH 5.5,Citation29 and pI_3DCitation71 in predicting PK clearance rate. Fast/slow clearance cutoff threshold and descriptor boundaries for Fv Charge at pH 5.5 and pI_3D are defined by Grinshpun et al.Citation71 (b) Scatter plot showing the performance of CDR_APBS_pos at pH 7.4 and CDR_HPATCH_WW in discerning fast-clearing antibodies. Point size represents relative clearance rate (mL/d/kg); color represents clearance classification (red: ≥ 5.4 mL/d/kg; green: < 5.4 mL/d/kg). (c) Histogram of CDR_APBS_pos for clearance set with bars proportionally colored according to clearance classification. Boundary defined in a shown as dotted lines. (d) Boxplot showing clearance rate distributions for molecules in- and out-of-range of CDR_APBS_pos thresholds. Performance of CDR_APBS_pos at pH 7.4 in predicting Heparin RTCitation72 (e-g), and PSR dataCitation26 (h-j) relative to TAP’sCitation28 CDR.PPC and MOE’sCitation33 ens_charge_FV using the same metrics and plots as . PSR and Heparin RT binary classes are defined using respective cutoffs of 0.27 and 0.84 minutes as used in the original papers.Citation26,Citation72
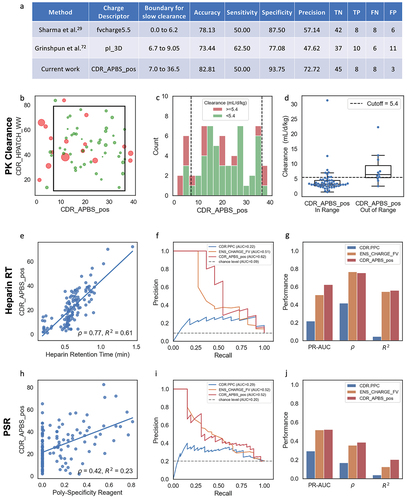
Figure 4. (a-c) Correlation of CDR_HPATCH_BM with SEC data for a panel of 15 Genentech IgG1 antibodies. (d-f) Correlation of CDR_HPATCH_BM with HIC retention time (RT) data from Jain et al.,Citation27 for a panel of 137 antibodies. (b and e) Precision–Recall curves demonstrating the performance of CDR_HPATCH_BM (current work), TAP’s CDR.PSH,Citation28 MOE’s CDR_HYD,Citation33 and SAPCitation39 in predicting binary classes, using thresholds of 1.94% Monomer Loss for SEC and 11.7 minutes for HIC RT. (c and f) Barplots showing the precision-recall area under the curve (PR-AUC), Spearman’s rho (ρ), and Pearson’s R2 correlations with SEC and HIC data for the listed descriptors.
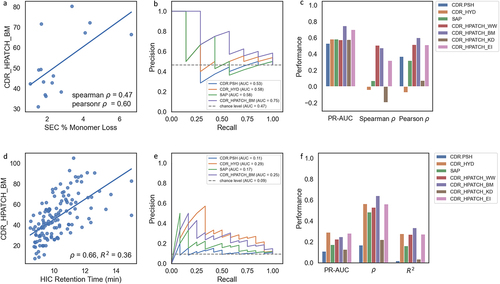
Figure 5. Matrix of scatter plots and distributions of the HPATCH hydrophobicity scores using four different scales (BM: Black & Mould, WW: Wimley-White, KD: Kyte-Doolittle, and EI: Eisenberg), for 674 clinical stage therapeutics (CST) from TheraSAbDabCitation80 and ∼2000 human antibodies randomly selected from the observed antibody space (OAS).Citation81 the descriptor values are calculated using single-static AB2 structure model. KDE distributions are normalized by dataset size.
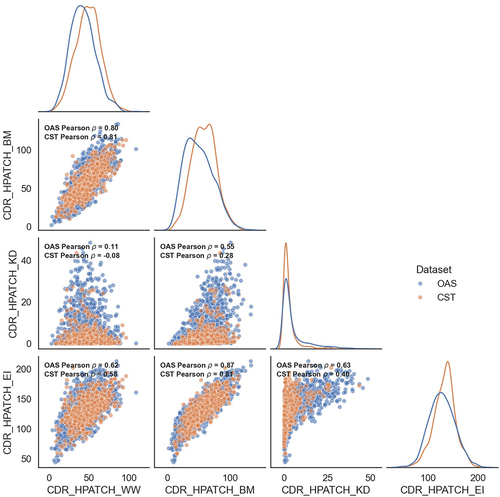
Figure 6. Impact of interior dielectric constant on Pearson ρ correlation between CDR_APBS_pos and two empirical assays: Heparin retention time (Hep RT)Citation72 (a) and PSRCitation26 (b). (c-d) Visualization of electrostatic potential on the surface of Omalizumab at extreme interior dielectric values (1 and 20). The descriptor values are calculated based on the conformation of the initial structure model (AB2) at pH 7.4.
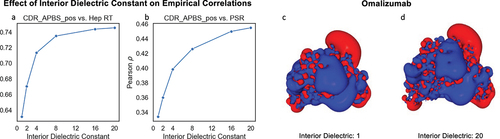
Figure 7. (a) Heatmap displaying the coefficient of determination (R2) for CDR_APBS_pos (above the diagonal) and CDR_HPATCH_BM (below the diagonal) values for 592 clinical antibodies. calculated using AB2, MOE, DeepAb, and equifold static structure models (snapshot), and the same R2 after averaging the values over GaMD simulations (b-c) Distributions of hydrophobic (CDR_HPATCH_BM) and positive patch (CDR_APBS_pos) values across 592 clinical antibodies, as a function of different structure models, for single-static snapshots and GaMD-averaged values. (d-e) Correlations between surface descriptors (CDR_HPATCH_BM and CDR_APBS_pos) derived from DeepAb and MOE structure models for 592 clinical antibodies for snapshot and GaMD-averaged values.
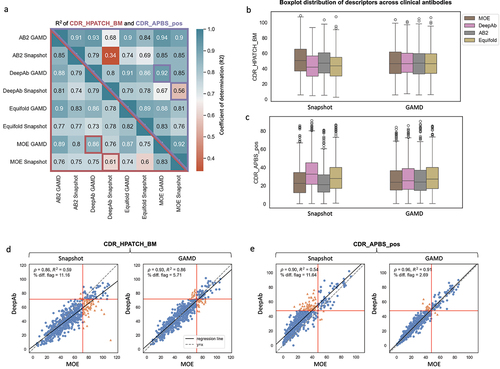
Figure 8. Performance (Pearson ρ and PR-AUC) of MolDesk descriptors in predicting empirical data across different predicted structure models (AB2, MOE, DeepAb, and Equifold), for both single-static snapshots and the average value of 5ns of GaMD simulations. Dotted lines represent the mean performance (Pearson ρ or PR-AUC) across the four structure models, colored by simulation mode (snapshot or 5ns GaMD). Standard deviation shown is of Pearson ρ or PR-AUC across structure models.
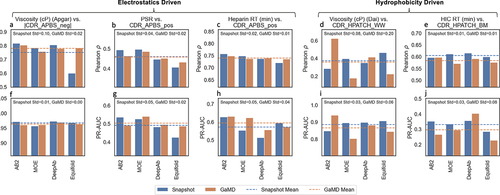
Figure 9. (A) Effect of simulation length on R2 correlation of the mean descriptor values for GaMD and conventional MD (cMD) trajectories at different time scales. The reference is the mean value descriptors calculated for a subset of 126 clinical antibodiesCitation27 over an aggregate of 1 μs (3×350ns) cMD Fab simulations. (B) Pearson ρ correlation of standard deviation of descriptor values calculated over MD trajectories (GaMD and cMD) relative to the same values from the reference simulations.
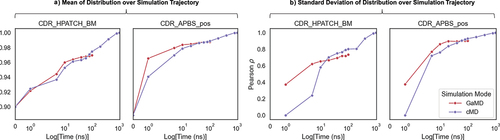
Table 1. MolDesk cutoff thresholds specifying categorical risk flags, computed using 629 clinical-stage molecules in 2023.Citation85
Figure 10. Developability risk flags for mAbH. Solid line distributions represent MolDesk descriptor mean values for 629 clinical-stage antibodies (TheraSAbDab),Citation80 with background colors matching the flagging regions according to cutoffs defined in . The dashed lines represent the distributions of the corresponding descriptor values for mAbH over a conformational distribution from 5ns GaMD, with the average of simulation values shown as a vertical line colored according to risk assignment.
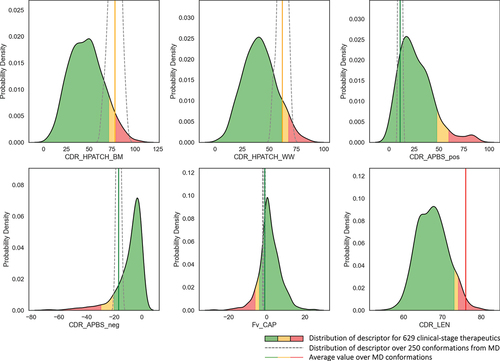
Table 2. Developability assessment for nine case study antibodies using MolDesk and TAP risk flags. “NF” stands for not flagged.
Table 3. Summary of antibody sequences and experimental biophysical datasets and their corresponding cutoff thresholds used in this study.