Figures & data
Figure 1. Integrin specificity of antibodies on all RGD-binding human and mouse integrin transfectants by indirect flow cytometry. (a) K562 stable human integrin transfectants in Ca2+/Mg2+. (b) Expi293 α5−/αV− cell transient human integrin transfectants in Ca2+/Mg2+. (c-g) Expi293 α5−/αV− cell transient mouse integrin transfectants in Ca2+/Mn2+. Immunostaining was performed with 50 nM IPI integrin antibody followed by washing and detection with APC-conjugated goat anti-human secondary antibodies and flow cytometry. MFI: mean fluorescence intensity.
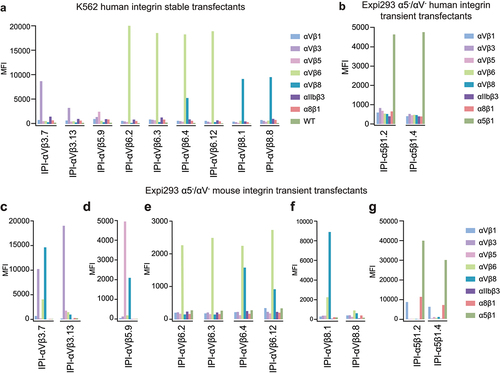
Table 1. IPI integrin antibody sequence.
Figure 2. Titration of antibodies on human RGD-binding integrin K562 stable transfectants by indirect flow cytometry. All antibodies were titrated against each transfectant in Ca2+/Mg2+ and immunostaining was as in . The mean fluorescent intensity (MFI) at each antibody concentration after subtraction of isotype control at the same concentration was fitted to a three-parameter dose–response curve for EC50, background MFI, and maximum MFI; curves are only shown for antibodies with meaningful staining. The errors for the EC50 values are the standard errors from the non-linear least square fits.
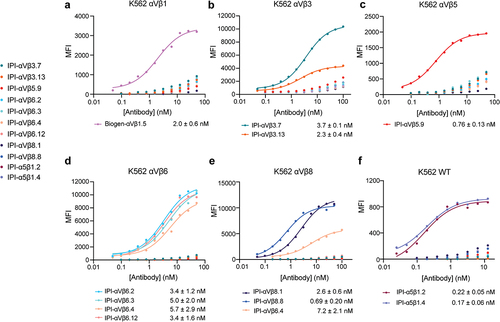
Table 2. Binding characteristics of IPI anti-integrin antibodies.
Figure 3. Surface plasmon resonance (SPR) binding kinetics with soluble integrin ectodomains. (a-m). Antibodies were captured on the surface with anti-Fc. Integrins in 10 mM HEPES pH 7.5, 150 mM NaCl, 1 mM MgCl2, 1 mM CaCl2, 0.05% Tween 20, and 0.5 mg/mL BSA were used at 0.78, 1.56, 3.12, 6.25, and 12.50 nM. SPR sensorgrams (thick gray lines) at each ectodomain concentration were globally fitted with 1 vs 1 Langmuir binding model for the on- and off-rates, kon and koff. KD values were calculated as koff/kon. Values are reported as means with standard deviations from three independent regions of interest (ROIs).
Figure 4. Binding affinities calculated from competition by RGD-mimetic antibodies of ectodomain binding to fluorescent RGD peptides using fluorescence polarization. (a-d) Competition of 10 nM FITC-cyclic-ACRGDGWCG binding to 200 nM αVβ1, 50 nM αVβ3, 50 nM αVβ5 or 100 nM α5β1. (e-f) Competition of 10 nM FITC-proTGFβ3 peptide binding to 10 nM αVβ6 or 200 nM αVβ8. Competitive antibody-binding curves were globally fittedCitation30 with the maximum FP value in the absence of antibody and the minimum FP value as global fitting parameters, and KD value for each antibody as individual fitting parameter (Methods). A reliable fit could not be obtained for the α5β1 minibinder and its EC50 value was calculated by fitting the curve with a three-parameter dose–response curve. Means and standard errors are from nonlinear least square fits.
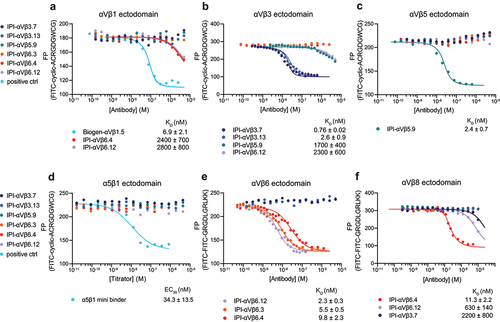
Figure 5. Binding affinities of RGD-mimetic antibodies for cell surface RGD-binding integrins by flow cytometry without washing. (a-c) Affinities on K562 stable transfectants or WT K562 cells were measured by enhancement of binding of 10nM AF647-9EG7 Fab. Cyclic-ACRGDGWCG and Biogen-αVβ1.5 were included as positive controls. Affinities and standard errors are from nonlinear least square fits of MFI values to a three-parameter dose–response curve. (d-h) Affinities on K562 stable transfectants were measured by competing fluorescently labeled RGD-mimetics. Affinities and standard errors are from nonlinear least square fits of MFI values to a three-parameter dose–response curve fitted individually (αVβ5 and αIIbβ3) or fitted globally (αVβ3, αVβ6 and αVβ8) with the minimum MFI and the maximum MFI as shared fitting parameters and EC50 for each titrator as individual fitting parameters. The KD value of each titrator was calculated from the EC50 value as KD = EC50/(1 + CL/KD,L), where CL is the concentration of the fluorescent peptidomimetic and KD,L is the binding affinity of the fluorescent peptidomimetic to the respective integrin ectodomain as referenced in methods. The errors for the affinities are the difference from the mean from duplicate experiments.
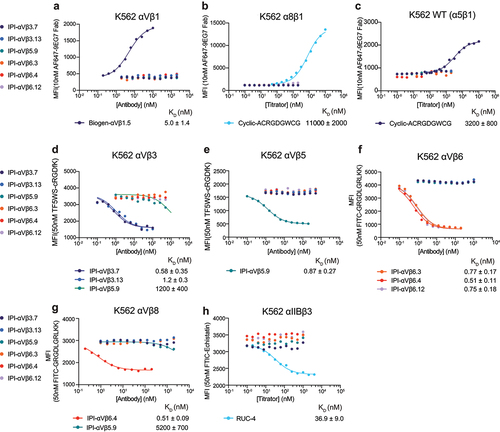
Figure 6. Affinities of RGD-mimetic antibodies and their fab fragments for cell surface integrins on K562 stable transfectants. Experimental setup and data fitting were as described in .
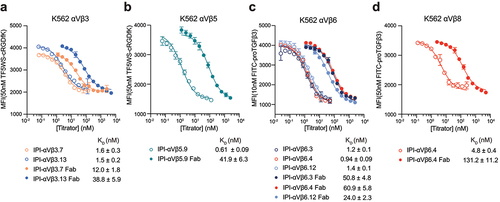
Figure 7. Inhibition of cell adhesion to ligands on substrates. Expi293 αV−/α5− KO cells transiently transfected with the indicated integrins were mixed with IPI anti-integrin antibodies and assayed for adhesion to ELISA plates coated with 30 nM fibronectin fragment (Fn3 7–12) (a-d) or with 10 nM GARP ectodomain/proTGFβ1 (e-f). After 1 hr at 37°C, the fluorescent intensity of mCherry, which was co-expressed with the transfected β-subunit using a self-cleaving P2A peptide, was recorded before and after washing away nonadherent cells. The fraction of cells bound at each antibody concentration was fitted individually or globally (if more than one antibody was fitted) to a four-parameter dose–response curve, with global fit to shared bottom and top and individual fit to IC50 and hill slope. Values are means and s.d. From triplicate measurements.
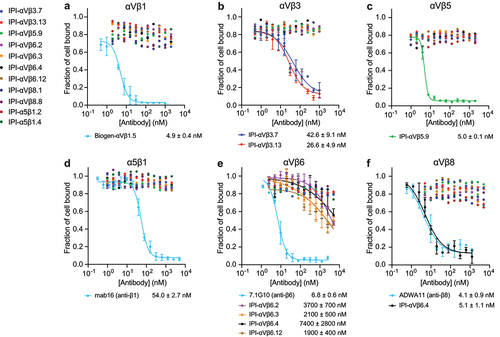
Figure 8. Competition between integrin β-subunits for the αV-subunit. (a-j.) MFI of directly fluorophore-labeled integrin antibodies measured by flow cytometry. In each competitive titration, the concentration of the αV-subunit plasmid (pαV) and one β-subunit plasmid remained constant at 0.6 µg (red line) while the other β-subunit plasmid (green line) was titrated until reaching 0.6 µg. The αV-subunit plasmid was 0.2 µg in a-e and h-i and 0.6 µg in f-g and j. in all reactions, empty vector plasmid was added to make the total plasmid concentration 1.8 µg. The ratio of the two β subunit plasmids at the cross point is indicated in each panel. The MFI of each β-subunit antibody was normalized relative to the MFI of the 17E6 αV antibody (Supplementary Figure S7).
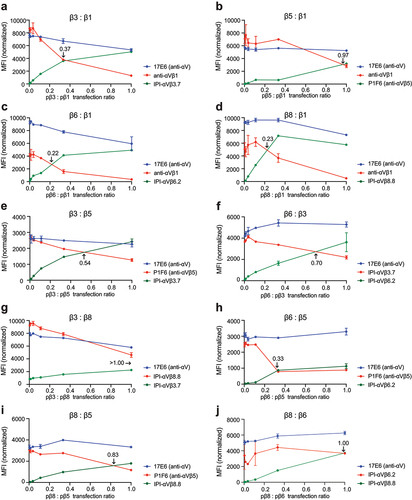
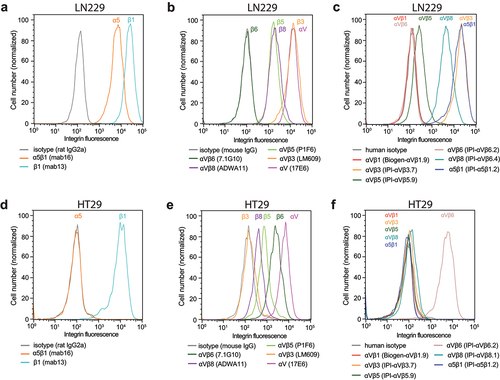
Figure 9. Immunostaining of cell surface integrins on LN229 cells (a-c) and HT29 cells (d-f). Cells were stained with 50 nM of the indicated anti-integrin antibodies or isotype control antibodies in HBSS buffer containing 1 mM Ca2+ and 1 mM Mg2+ except for IPI-αVβ5.9 which used 1 mM Mn2+ and 0.2 mM Ca2+. After washing, integrin antibodies were detected using APC-conjugated goat anti-human secondary antibodies, Alexa Fluor 647 goat anti-rat IgG, or Alexa Fluor 647 goat anti-mouse F(ab’)2, and flow cytometry.