
Figures & data
Figure 1. Crystal structure of E10 antibody with CD3ε peptide (PDB 8VY4) informs design of pro-TCE. (a) Top-down view of the isolated CDR loops (green) from anti-CD3 antibody E10 in contact with the CD3ε peptide antigen (pink). Key binding interaction features are highlighted from left to right respectively: N-terminal pyroglutamate, CDRH3 contacts with CD3ε, and CDRL3 contacts with CD3ε. (b) Fluorescence polarization binding data with WT and alanine mutant CD3ε peptides with anti-CD3 hE10 fab. The table below shows two KD values for WT. “WT*” represents our best estimate for KD and associated error from all replicates, while “WT*” and all other KD values in the table are the fitted values and errors to the fit from the specific experiment shown in the figure. (c) PyRosetta Model of designed pro-TCE anti-CD3 antibody fragment and sequence of CD3ε peptide (pink) prepended with MMP-2 cleavage sites (blue). (d) Fluorescence polarization binding data with pro-TCE antibody fragment before and after MMP-2 proteolysis. KD with reported standard deviation of the mean is shown for two replicate measurements. *Q undergoes cyclization to pyroglutamic acid (Pyr) under physiological conditions.
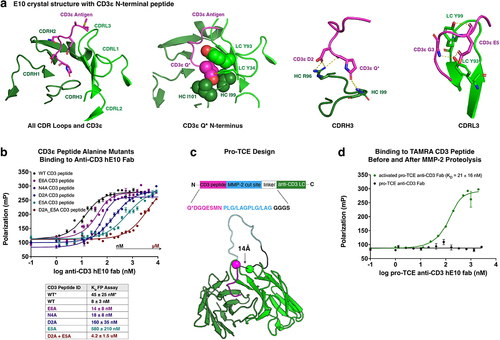
Figure 2. Recombinant expression, assembly and biophysical characterization of pro-TCE. (a) Interface mutations across the antibody fab and Fc framework regions facilitate proper recombinant assembly of IgG bispecific antibodies. (b) SDS-PAGE gel electrophoresis showing recombinant MMP-2 before and after activation with APMA, and the pro-TCE before and after proteolysis with the active MMP-2. Protein samples treated with βMe. (c) Fluorescence polarization binding data with pro-TCE IgG before and after MMP-2 proteolysis. The reported KD values are averages with errors reflecting the standard deviation of the mean for three replicates. (d) Biolayer interferometry data of the immobilized pro-TCE and parental anti-HER2 pertuzumab binding to HER2 extracellular domain before proteolysis. (e) Biolayer interferometry data of the immobilized pro-TCE and parental anti-CD3 hE10 mAb binding to CD3γε extracellular domain before and after proteolysis. In (d-e) the reported KD values are averages along with the standard deviation of the mean for two replicates.
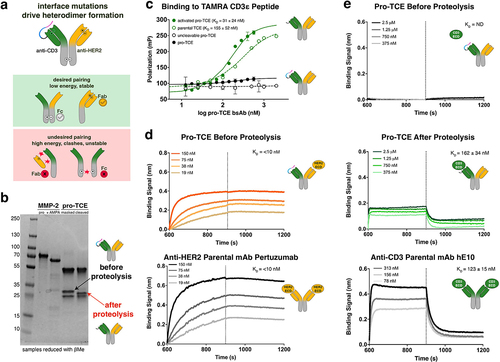
Figure 3. Preclinical functional validation of pro-TCE with recombinant MMP-2 protease treatment. All experiments were performed at an effector cell to target cell ratio of 1:1. Each point represents the mean value of triplicates. (a) T cell activation induced by pro-TCE after proteolysis using a Jurkat NFAT-Luciferase T cell model. (b) HER2+ target cell killing by hPBMCs induced by pro-TCE after proteolysis after 48 hours. (c–d) IL-2 and IFN-γ secretion by hPBMCs induced by pro-TCE after 48 hours. The reported errors for the EC50 values are the 95% confidence intervals from fitting each individual experiment.
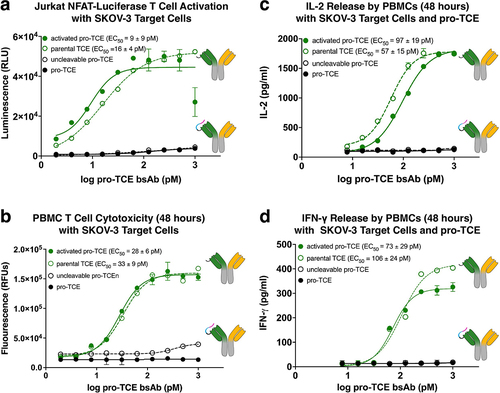
Figure 4. NCI-N87 tumor cell secreted proteases trigger pro-TCE activity. SDS-PAGE gel electrophoresis of pro-TCE before and after incubation with NCI-N87 cellular supernatant for 1 h (left). Jurkat NFAT-Luciferase T cell activation assay with NCI-N87 target cells (right). The reported EC50 value is an average of three replicates with errors reflecting the 95% confidence intervals of the average measurements.
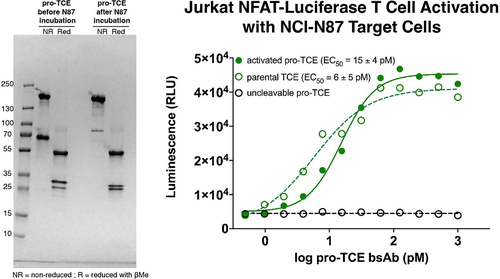
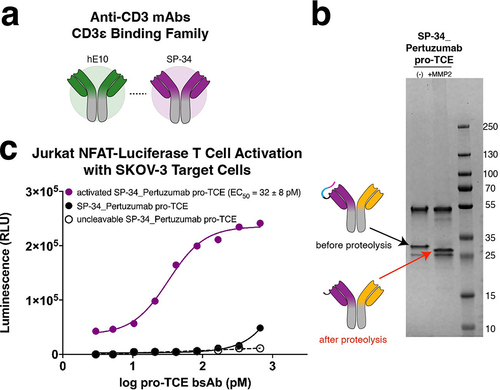
Figure 5. Expanding the pro-TCE conditionally active T cell engager platform to clone SP34. (a) Anti-CD3 mAbs hE10 and SP34 both bind the N-terminus of CD3ε. (b) SDS-PAGE gel electrophoresis of SP34_Pertuzumab pro-TCE before and after proteolysis. (c) Designed pro-TCE using anti-CD3 mAb with SP34 CD3-binding arm activates Jurkat NFAT-Luciferase T cells when proteolyzed but not when masked. The reported EC50 value is an average of three replicates with errors reflecting the 95% confidence intervals of the average measurements.
2024_mAbs_supplement_Revision_ACM_V1.docx
Download MS Word (2.4 MB)Data availability statement
Coordinates and structure factors for E10 fab complexed to the CD3ε-N7 peptide at pH 6.5 have been deposited in the Protein Data Bank under accession code 8VY4. All other data are available in the manuscript or supplementary materials.