
Figures & data
Figure 1. Design of anti-IL-2 antibody-IL-2 fusion proteins with IL-2 circular permutation, to target IL-2 Rβγ. (a) schematic representation of the strategy used to fuse antibodies A, B or C (shown with respective affinities to IL-2 measured by BLI) to IL-2. The antibody-cytokine fusion protein is represented as a drawing or linear construct from N-terminus to C-terminus. (b) IL-2 (aldesleukin) and IL-2 fusion proteins to antibody A, B and C with different linker lengths (G: glycine, S: serine) characterized for their binding affinity to IL-2 Rα, measured by SPR and EC50 values for STAT5 phosphorylation on NK cells, CD8+ T cells and Treg cells. (c) left: crystal structure of IL-2 (blue) in complex with IL-2 Rα (green). Residues of IL-2 in contact with the IL-2 Rα receptor are highlighted in red (PDB code 2B5I). Right: crystal structure of ANV419 (PDB code 8RY2) with parts of ANV419 VH (dark gray), ANV419 VL (light gray), linkers (black) and permuted IL-2 (blue). IL-2 residues in contact with the CDRs of antibody a are highlighted in red. (d) binding kinetics data of ANV419-fab, recombinant IL-2 or recombinant IL-15 fragment to IL-2 Rα and IL-2 Rβγ complex; association (ka) and dissociation (kd) rate constants; affinity constant (KD); half-life of complex T1/2 (= ln2/kd). BLI, Bio-layer interferometry; CDR, complementarity-determining region; EC50, half-maximal effective concentration; IL-2CP, circularly permuted IL-2; VL, variable domain of the antibody light chain; VH, variable domain of the antibody heavy chain.
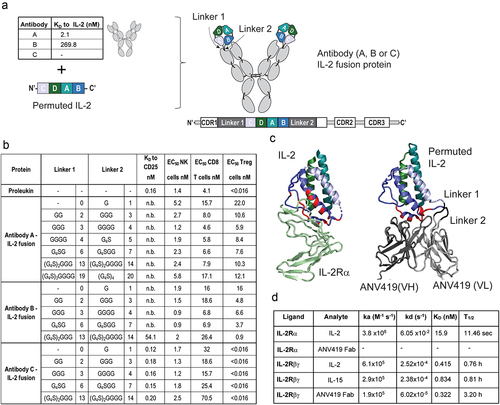
Figure 2. ANV419 preferentially stimulates CD8+ T cells and NK cells with reduced potency for Treg cells. (a) percentage of phosphorylated STAT5 (pSTAT5)-positive cells out of the parent cell population (CD8+ T cells, NK cells and Treg cells) of mouse splenocytes after 15 min stimulation with a dilution series of IL-2 fusion protein to Antibody C (linker lengths 3, 4), IL-2 (aldesleukin) or ANV419. n = splenocytes from 3 mice, mean ± SEM is shown. (b) percentage of Ki67-positive cells out of the parent population measured in blood from C57BL/6 mice administered with 0.2 mg/kg compound or vehicle control on day 0. n = 3 mice, mean ± SEM (c) percentage of Ki67-positive cells out of the parent population measured in blood from C57BL/6 mice administered with increasing concentrations of ANV419. n = 3 mice, mean ± SEM is shown. NK, natural killer; Treg, regulatory T cells; SEM, standard error of the mean.
Figure 3. ANV419 treatment inhibits tumor growth alone or when combined with CPIs by increasing CD8+ T cells and NK cells in the tumor. Groups of 10–12 mice were s.c. injected with H22 (a – c), Renca (d), or B16F10 (e) tumor cells and randomly assigned to treatment groups on day 0 when the mean tumor size reached ~ 80–100 mm3. Starting on day 1 the mice were i.v. treated with vehicle, 0.2 mg/kg ANV419, 10 mg/kg anti-PD-1, 1 mg/kg anti-CTLA-4, or a combination thereof, twice or three times per week. Tumor volumes were measured three times per week. Tumor volumes mean ± SEM are shown. f-g) groups of 12 mice were s.c. injected with Renca tumor cells, randomized when the tumors reached a mean size of ~ 80–100 mm3, and treated with vehicle or 0.2 mg/kg ANV419 on days 1 and 3. TILs were isolated from the tumors on day 5 and analyzed by flow cytometry. Cell numbers per gram tumor tissue (f) and proliferation as % of Ki67+ from parental cells (g) for CD8+, NK cells and Treg cells. CPIs, checkpoint inhibitors; CTLA-4, cytotoxic T-lymphocyte-associated protein 4; i.v., intravenous; PD-1, programmed death 1; s.c., subcutaneous; SEM, standard error of the mean; TILs, tumor infiltrating lymphocytes. ns: p > 0.05; *: p ≤ 0.05; **: p ≤ 0.01; ***: p ≤ 0.001; ****: p ≤ 0.0001. For A–E statistical analysis was performed for the terminal timepoint; unpaired T-test with Welch’s correction for A, D–G. One-way ANOVA multiple comparison against vehicle control for B and C.
Figure 4. ANV419 shows selectivity for human CD8+ T cells and NK cells and induces STAT5 phosphorylation at a comparable magnitude and kinetics as recombinant IL-2 and IL-15. (a) PBMCs were stimulated with ANV419 or IL-2 and after 15 min STAT5 phosphorylation was assessed by flow cytometry in CD8+ T cells, NK cells, CD4+ T cells and Tregs. n = 4 donors; mean ± SEM is shown. EC50 values calculated with non-linear regression (curve fit, sigmoidal, 4PL). (b–c) PBMCs from 3 donors were stimulated with 10 nM ANV419, IL-2, IL-15 or left untreated, and STAT5 phosphorylation was measured at the indicated time points in CD8+ T cells and NK cells. B depicts the time course up to 16 min; C depicts the time course from 15 min up to 24 h. NK, natural killer; PBMCs, peripheral blood mononuclear cells. Mean ± SEM is shown.
Figure 5. ANV419 increases NK cell killing capacity in vitro and enhances antibody-mediated tumor growth retardation in vivo. (a) NK cells purified from healthy donor PBMCs were incubated with or without ANV419 and co-cultured with NCI-H929 target cells in the presence or absence of daratumumab. n = 14 donors. (b) NK cells purified from healthy donor PBMCs were incubated with or without ANV419 and co-cultured with HER2+ HCC1954 target cells in the presence or absence of trastuzumab. n = 10 donors. A–B) annexin V positive cells as a percentage of the signal measured with the positive control (staurosporine). Mean ± SEM is shown. Statistical significance was determined by paired one-way ANOVA test. ns: p > 0.05; *: p ≤ 0.05; **: p ≤ 0.01; ***: p ≤ 0.001; ****: p ≤ 0.0001. (c) BALB/c nude mice with s.c. NCI-N87 tumors were i.v. treated with vehicle, 7.5 mg/kg trastuzumab twice per week (BIW), 0.22 mg/kg ANV419 once a week or a combination of trastuzumab and ANV419. n = 8 mice; mean ± SEM is shown; *p ≤ 0.05, **p ≤ 0.01 on Day 40. One-way ANOVA multiple comparison.
Figure 6. ANV419 has an extended half-life and promotes the proliferation of CD8+ T cells and NK cells in cynomolgus monkeys. ANV419 was administered i.v. At 0.03 mg/kg, 0.1 mg/kg, or 0.3 mg/kg on days 1 and 15. a) the pharmacokinetic profile of ANV419 was measured in serum after the first (day 1) and second dose (day 15). b) the time course of CD8+ T cell, NK and Treg expansion (cell count/μL) and proliferation (Ki67) was determined by immunophenotyping of whole blood samples pre-dose (days 1 and 15) and after ANV419 i.v. administration. Top: CD8+ T cell, NK cell and Treg cell count/μL blood. Bottom: % Ki67+ cells from parental population for CD8+ T cells, NK cells and Treg cells. n = 6 animals (3 males, 3 females) per group, mean ± SEM is shown.
Figure 7. ANV419 induces a transient dose-dependent inflammatory response. cynomolgus monkeys were injected with ANV419 i.v. On days 1 and 15. a) CRP, IL-1Ra and IL-10 serum levels. CRP samples were collected from pre-dose to Day 29. IL-1Ra and IL-10 data samples were taken at first dose pre-dose, 4 h, 24 h and 72 h. b) platelet and eosinophil counts in whole blood. Normal range for eosinophils observed at Charles River Laboratories in cynomolgus monkeys c) body weight (in kg) and blood pressure (diastolic and systolic) over the study period. n = 6 (3 males and 3 females) per group, mean ± SEM is shown. CRP, C-reactive protein.
KMAB-2024-0047R2_Supp M_M and tables.docx
Download MS Word (47.6 KB)KMAB-2024-0047R2_Supp Figures.docx
Download MS Word (3.3 MB)Data availability statement
All data relevant to the study are included in the article or uploaded as supplementary information. Diffraction data and crystallographic coordinates for ANV419 have been deposited with the PDB code