864
Views
3
CrossRef citations to date
0
Altmetric
Article Addendum

Dynamic buckling of actin within filopodia

, &
Article: e1022010 | Received 13 Feb 2015, Accepted 17 Feb 2015, Published online: 29 Apr 2015

Figures & data

Figure 1. Dynamics of actin inside a filopodium extended from a HEK293 cell. (A) Fluorescent images of actin within a filopodium extended and held by an optically trapped bead. The snap shots are taken at different times during one experiment where the actin exhibits different degrees of bending and pulling. Pulling was detected as a downward movement of the bead (toward the cell and away from the optical trap). The last image to the right is an overlay of all the other images. Scale bar, 5 μm. (B) Statistics of the waiting times for the first buckle to occur on filopodia that are extended by the optical trap, N = 43 buckles. The inset shows the waiting times after which additional buckles occurred (second, third, …), N = 52 buckles. Up to 6 buckles could be observed in a single filopodium during a measurement period of ∼10 min. Only clearly resolved and isolated buckles were counted and the uncertainty in determining the buckling time from the image series was ∼3 s. (C) Correlation between the force on the trapped bead and the actin intensity at the tip region. Rapid drops in the force (blue curve) were associated with rapid decreases in the actin intensity (green curve). Yellow arrows denote correlative events at which the force drops rapidly with associated decrease in actin signal.
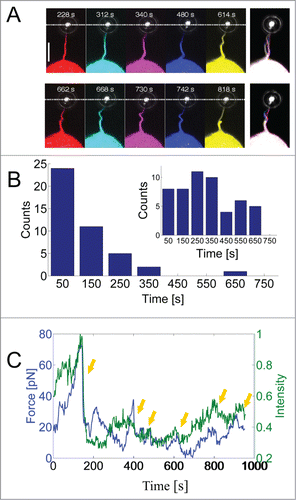
Figure 1. Dynamics of actin inside a filopodium extended from a HEK293 cell. (A) Fluorescent images of actin within a filopodium extended and held by an optically trapped bead. The snap shots are taken at different times during one experiment where the actin exhibits different degrees of bending and pulling. Pulling was detected as a downward movement of the bead (toward the cell and away from the optical trap). The last image to the right is an overlay of all the other images. Scale bar, 5 μm. (B) Statistics of the waiting times for the first buckle to occur on filopodia that are extended by the optical trap, N = 43 buckles. The inset shows the waiting times after which additional buckles occurred (second, third, …), N = 52 buckles. Up to 6 buckles could be observed in a single filopodium during a measurement period of ∼10 min. Only clearly resolved and isolated buckles were counted and the uncertainty in determining the buckling time from the image series was ∼3 s. (C) Correlation between the force on the trapped bead and the actin intensity at the tip region. Rapid drops in the force (blue curve) were associated with rapid decreases in the actin intensity (green curve). Yellow arrows denote correlative events at which the force drops rapidly with associated decrease in actin signal.