713
Views
1
CrossRef citations to date
0
Altmetric
Research Paper

Fluorescent monitoring of copper-occupancy in His-ended catalytic oligo-peptides

&
Article: e1156277 | Received 21 Jan 2016, Accepted 12 Feb 2016, Published online: 27 Jul 2016

Figures & data

Figure 1. Different quenching action of copper ion against intrinsic tyrosine fluorescence in GFP-derived fluorophore sequence with and without fusing to copper binging sequence hexapeptide. Peptides (30 μM) used were Gfp-G5H (TFSYGVQ-GGGGGH) and Gfp (TFSYGVQ). Peaks of tyrosine fluorescence (emission at ca. 320 nm) were observed with excitation at 230 nm (a) and 280 nm (b). Quenching of fluorescence in the presence of 30 μM CuSO4 was assessed.
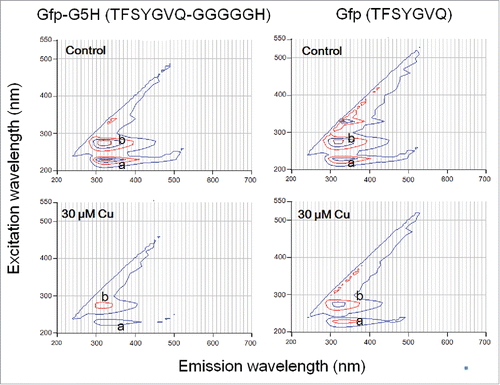
Figure 1. Different quenching action of copper ion against intrinsic tyrosine fluorescence in GFP-derived fluorophore sequence with and without fusing to copper binging sequence hexapeptide. Peptides (30 μM) used were Gfp-G5H (TFSYGVQ-GGGGGH) and Gfp (TFSYGVQ). Peaks of tyrosine fluorescence (emission at ca. 320 nm) were observed with excitation at 230 nm (a) and 280 nm (b). Quenching of fluorescence in the presence of 30 μM CuSO4 was assessed.

Figure 2. Effect of copper ion on quenching of intrinsic fluorescence signals by three GFP fluorophore-derived oligo-peptides conjugated with copper-binding hexapeptide motif. Peptides (30 μM) used were Gfp-G5H (TFSYGVQ-GGGGGH), TYG-G5H (TYG-GGGGGH), and SYG-G5H (SYG-GGGGGH). In the absence of CuSO4, two typical peaks of tyrosine fluorescence (emission at ca. 320 nm) were observed with excitation at 230 nm (a) and 280 nm (b). Quenching of fluorescence in the presence of 10, 25 and 100 μM CuSO4 was assessed.
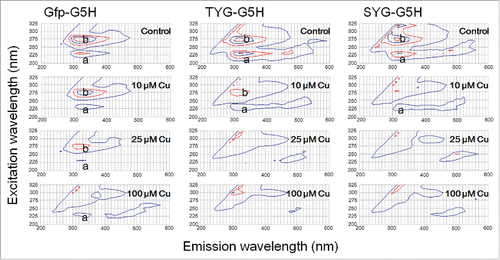
Figure 2. Effect of copper ion on quenching of intrinsic fluorescence signals by three GFP fluorophore-derived oligo-peptides conjugated with copper-binding hexapeptide motif. Peptides (30 μM) used were Gfp-G5H (TFSYGVQ-GGGGGH), TYG-G5H (TYG-GGGGGH), and SYG-G5H (SYG-GGGGGH). In the absence of CuSO4, two typical peaks of tyrosine fluorescence (emission at ca. 320 nm) were observed with excitation at 230 nm (a) and 280 nm (b). Quenching of fluorescence in the presence of 10, 25 and 100 μM CuSO4 was assessed.

Figure 3. Effect of copper concentration on quenching of 230 nm excitation/3;20 nm emission signals by three G5H-conjugated GFP fluorophore-derived oligo-peptides. Peptides (30 μM) used were as in . Quenching of fluorescence was performed with 5–100 and 100 μM CuSO4 was assessed. Three different symbols represent the data points obtained. Curves were merely approximation of the response (note that they are not regression curves). In the inset, linear relationships between the remitted range of Cu concentration (up to 40 μM) and the decrease in peptidic fluorescent signals are shown.
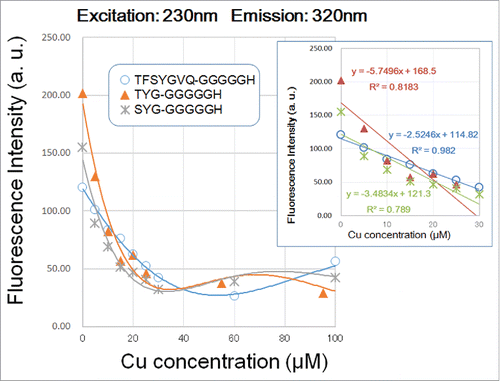
Figure 3. Effect of copper concentration on quenching of 230 nm excitation/3;20 nm emission signals by three G5H-conjugated GFP fluorophore-derived oligo-peptides. Peptides (30 μM) used were as in Figure 2. Quenching of fluorescence was performed with 5–100 and 100 μM CuSO4 was assessed. Three different symbols represent the data points obtained. Curves were merely approximation of the response (note that they are not regression curves). In the inset, linear relationships between the remitted range of Cu concentration (up to 40 μM) and the decrease in peptidic fluorescent signals are shown.
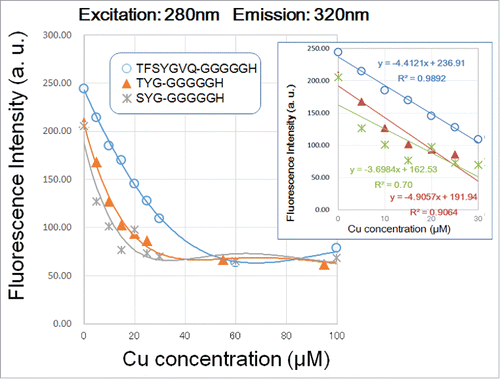
Figure 4. Effect of copper concentration on quenching of 280 nm excitation/320 nm emission signals by three G5H-conjugated GFP fluorophore-derived oligo-peptides. Peptides (30 μM) used were as in . Quenching of fluorescence was performed as in . In the inset, linear relationships between the remitted range of Cu concentration (up to 40 μM) and the decrease in peptidic fluorescent signals are shown.

Figure 4. Effect of copper concentration on quenching of 280 nm excitation/320 nm emission signals by three G5H-conjugated GFP fluorophore-derived oligo-peptides. Peptides (30 μM) used were as in Figure 2. Quenching of fluorescence was performed as in Figure 3. In the inset, linear relationships between the remitted range of Cu concentration (up to 40 μM) and the decrease in peptidic fluorescent signals are shown.

Figure 5. Changes in UV-excited fluorescence contour spectra in three peptides after addition of copper and/or excess hydrogen peroxide. Peptides used were as in , namely Gfp-G5H, TYG-G5H and SYG-G5H. Each peptide (30 μM) was treated with none, either or both of CuSO4 (30 μM) or/and H2O2 (1 mM). Numbers after (a) and (b) shown with each spectrum represent the relative changes in fluorescence intensities at peaks a (230 nm excitation/320 nm emission) and b (280 nm excitation/320 nm emission), respectively.
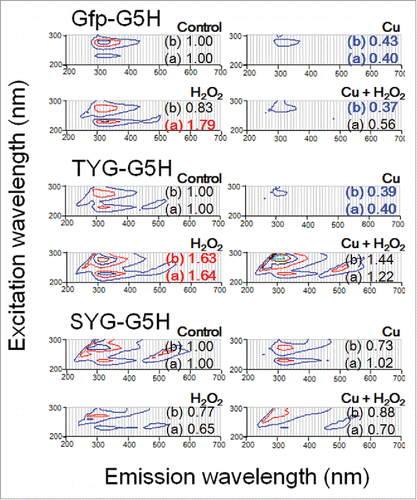
Figure 5. Changes in UV-excited fluorescence contour spectra in three peptides after addition of copper and/or excess hydrogen peroxide. Peptides used were as in Figure 2, namely Gfp-G5H, TYG-G5H and SYG-G5H. Each peptide (30 μM) was treated with none, either or both of CuSO4 (30 μM) or/and H2O2 (1 mM). Numbers after (a) and (b) shown with each spectrum represent the relative changes in fluorescence intensities at peaks a (230 nm excitation/320 nm emission) and b (280 nm excitation/320 nm emission), respectively.