
Figures & data
Table 1. Active ingredient of agrochemicals used in experiments.
Figure 1. Metrological data during the course of present studies (Source: Near–caspian scientific research institute of arid agriculture).
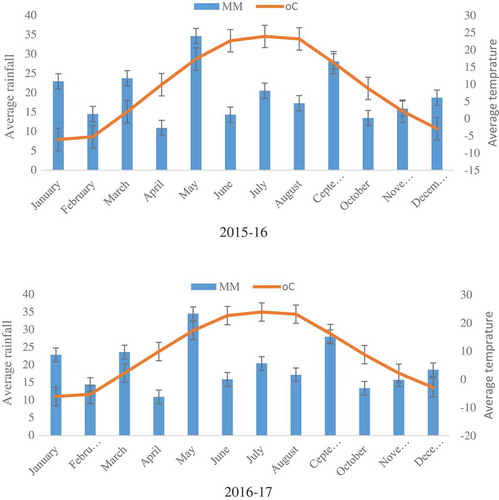
Table 2. Dynamics of the total water content of leaves under the influence of various foliar fertilization (%) – mean values 2015–2017.
Table 3. Dynamics of water deficiency of leaves under the influence of foliar treatments (%) – mean values 2015–2017.
Table 4. Dynamics of relative leaf turgidity under the influence of foliar treatments (%) – mean values 2015–2017.
Table 5. Dynamics of water retention capacity of leaves (%) – mean values 2015–2017.
Table 6. Effect of treatments on the yield of pear and apple varieties – mean values 2015–2017.
Table 7. Coefficient of water consumption of pear and apple varieties according to the variants of the experiment (m3/t) – mean values 2015–2017.