Figures & data
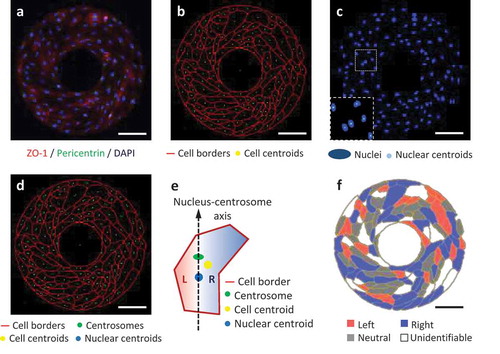
Figure 1. L-R biases of micropatterned hUVECs analyzed from the fluorescent images. (a) Immunofluorescence of hUVECs on a ring-shaped micropattern showing cell junctions (ZO-1, red), cell nuclei (DAPI, blue) and centrosomes (pericentrin, green). (b) Cell borders segmented from the ZO-1 channel in (a), shown with the calculated cell centroids (yellow). (c) Cell nuclei (blue) segmented from the blue channel in (a), shown with nuclear centroids (cyan). (d) Merged image for cell bias analysis, including cell borders (red), centrosomes (green), nuclear centroids (blue) and cell centroids (yellow). (e) A schematic of determination of the left (L) or right (R) cell bias according to the positioning of the cell centroid relative to the nucleus-centrosome vector. (f) Color-coded cells by their biases on the micropattern. Scale bars: 100 um.