Figures & data
Figure 1. t-CA-induced rosette growth responses of ref3 mutants. (a) Summary of previous findings that suggest that t-CA or a t-CA derivative promotes plant cell expansion. [Citation2] PAL, phenylalanine ammonia-lyase; C4H, cinnamic acid 4-hydrolase; KFB20 OE, Kelch repeat F-box protein 20 overexpressor. (b) Rosettes of 20-day-old plants. The upper panel shows wild type plants (Ler) and ref3-1 plants grown on MS/2 (control) media. The frequencies of ref3-1 rosette phenotypes are noted as percentages (n = 89). Insert shows the seeds of the progeny of each phenotypical class. The lower panel shows rosettes of the Col-0 wild type and ref3-3 plants grown on control media. (c) Fresh weight of rosettes of Col-0, ref3-3 and KFB20 OE plants grown on control and t-CA-supplemented medium for 20 days. Data are presented as mean ± SD (n ≥ 12 pools of 6 plants each). The significance of the difference between the mean fresh weight between lines grown on control media (black arrows) and between controls and the treated samples (dashed, gray arrows) is noted (****, P < 0.0001; two-way ANOVA with Tukey’s post-test).
![Figure 1. t-CA-induced rosette growth responses of ref3 mutants. (a) Summary of previous findings that suggest that t-CA or a t-CA derivative promotes plant cell expansion. [Citation2] PAL, phenylalanine ammonia-lyase; C4H, cinnamic acid 4-hydrolase; KFB20 OE, Kelch repeat F-box protein 20 overexpressor. (b) Rosettes of 20-day-old plants. The upper panel shows wild type plants (Ler) and ref3-1 plants grown on MS/2 (control) media. The frequencies of ref3-1 rosette phenotypes are noted as percentages (n = 89). Insert shows the seeds of the progeny of each phenotypical class. The lower panel shows rosettes of the Col-0 wild type and ref3-3 plants grown on control media. (c) Fresh weight of rosettes of Col-0, ref3-3 and KFB20 OE plants grown on control and t-CA-supplemented medium for 20 days. Data are presented as mean ± SD (n ≥ 12 pools of 6 plants each). The significance of the difference between the mean fresh weight between lines grown on control media (black arrows) and between controls and the treated samples (dashed, gray arrows) is noted (****, P < 0.0001; two-way ANOVA with Tukey’s post-test).](/cms/asset/4ada82f9-ed7c-4f83-b8e9-0c68e487a8d9/kcib_a_1605814_f0001_oc.jpg)
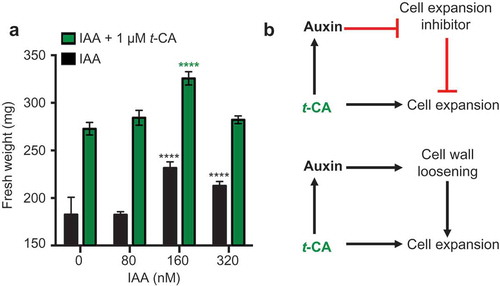
Figure 2. Comparative analysis of the effects of auxin and t-CA on rosette growth. (a) Effects of indole-3-acetic acid (IAA) on the fresh weight of rosettes from wild-type plants grown for 20 days on MS/2 media containing the denoted doses of t-CA and IAA. Data are presented as mean ± SD (n ≥ 12 pools of 8 plants each). All differences between the IAA and IAA/t-CA treated samples for each IAA concentration are significant at P < 0.0001 (not marked; two-way ANOVA with Sidak’s multiple comparisons test). The significance of the difference between the fresh weight of plants grown control media and on different IAA-supplemented media is shown in black and between different t-CA control and t-CA/IAA co-treated plants treatments is shown in green (****, P < 0.0001; two-way ANOVA with Sidak’s multiple comparisons test). (b) Hypothetical models for the additive mechanism of action of IAA and t-CA in leaf growth promotion.