
Figures & data
Table 1. Material used in experiments and the experiments sizes. For experiments 4 and 5, the number of pollinations made with different male progenitors is specified within parenthesis.
Figure 1. Cassava (Manihot esculenta Cranz). Visualization of pollen tube pathway from stigma to embryo sac. a. Crossection of the cassava pistil (paraffin section 8 µm thick stained with safranin and fast green). b. The same parts of pistil as visible on A shown on preparation of ovules dissected from the pistil and stained with aniline blue, analyzed under UV light. Labels 1–6 show the main checkpoints for pollen tube growth analysis [Citation1]. PTT on the stigma surface or its shallow ingrowth into the transmitting tissue (TT) (a, b1) [Citation2]; PTT in the transmitting tissue of the style (a, b2) [Citation3]; PTT at the bottom of the style (a, b2) [Citation4]; PTT in the obturator (Ob) (a, b2) [Citation5]; PTT in the nucellar beak (Nb), (a, b2); and [Citation6] PTT at the embryo sac (ES), (a, b2). Outer (Oi) and inner (Ii) integuments of the ovules are also visible. Pictures were composed of several images ensemble together. Magnification A, B2 10x, B1 20x (scale bar = 200 μm).
![Figure 1. Cassava (Manihot esculenta Cranz). Visualization of pollen tube pathway from stigma to embryo sac. a. Crossection of the cassava pistil (paraffin section 8 µm thick stained with safranin and fast green). b. The same parts of pistil as visible on A shown on preparation of ovules dissected from the pistil and stained with aniline blue, analyzed under UV light. Labels 1–6 show the main checkpoints for pollen tube growth analysis [Citation1]. PTT on the stigma surface or its shallow ingrowth into the transmitting tissue (TT) (a, b1) [Citation2]; PTT in the transmitting tissue of the style (a, b2) [Citation3]; PTT at the bottom of the style (a, b2) [Citation4]; PTT in the obturator (Ob) (a, b2) [Citation5]; PTT in the nucellar beak (Nb), (a, b2); and [Citation6] PTT at the embryo sac (ES), (a, b2). Outer (Oi) and inner (Ii) integuments of the ovules are also visible. Pictures were composed of several images ensemble together. Magnification A, B2 10x, B1 20x (scale bar = 200 μm).](/cms/asset/a60503e9-7014-4809-bb00-d1105625ff51/kcib_a_1631110_f0001_oc.jpg)
Figure 2. Cassava (Manihot esculenta Cranz) stigmas stained with aniline blue and analyzed with UV, wideband filter. a. Stigma in freshly exposed flower. Stigma’s edges are dark blue. Vascular bundles visible on the right lower corner show pale fluorescence. b. Germinating pollen on the stigma. One pollen tube shallow ingrowth to the stigma is visible in the center. Stigmatic tissue gives bright callose reaction in the vicinity of pollen grains. c. Stigma fixed three days after pollination. Fluorescence of two grains and their tubes has faded. Stigma surface gives strong yellow fluorescence typical for a fading process (scale bar = 100 μm).
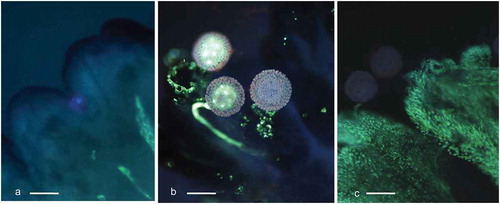
Figure 3. Cassava (Manihot esculenta Cranz). Series of pictures from dissected ovules stained at different time points to demonstrate pollen tube passage through the ovule. a. An ovule dissected from a flower at time of bracts opening. Integuments were removed. Nucellus forms large beak (Nb). b-d. Fragments of ovules dissected 18 h after pollination (HAP) showing variability of pollen tubes length. Several tubes are visible on c and d. The dominating pollen tube reaches vicinity of the embryo sac on d. Callose reaction is visible in beak after pollen tubes passage. e. Ovule fixed 42 HAP with pollen tube entering the egg apparatus. f. A pollen tube entered the egg apparatus giving a strong fluorescence in one of the cells. The second pollen tube stopped and swollen at the narrowest part of the beak, so-called pseudomicropyle. Oi – outer integument, Ii – inner integument (scale bar = 100 μm).
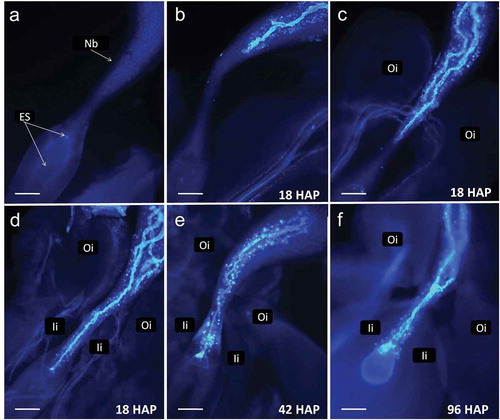
Figure 4. Average monthly rainfall in the 1980–2014 period and during the period in which Experiments 3–5 were conducted. Boxes indicate the duration of each experiment. Arrows indicate the range of variation (minimum to maximum) temperatures, respectively, for each experiment. Black circles indicate average temperature along each experiment.
Figure 5. Fruit (a) and seed (b) set observed from female cyathia that were subjected to different treatments: flowers not covered (0 days) or covered for 1, 2 or 3 days after anthesis (horizontal axis). The two independent trials were carried out to assess the duration of stigma receptivity. The vertical axis in the left plot presents the number of fruits per flower counted in the first trial. The vertical axis in the plot on the right presents the actual number of seeds in relation to the expected number based on the total number of flowers considered (three seeds per pistil). SM1219–9, Nga 11, HMC1 are cassava clones, Mixture – represent numerous other clones available in the field when Trial 1a began. AVERAGE represents the mean value of three types of genotype in each trial.
Table 2. Analysis of variance for data from Experiment 2 in which pistils from SM 1219-9 were self- or cross-pollinatinated with HMC1 (30 flowers for each type of cross yielding a total of 180 ovules). Pollinations were made one day before anthesis, on the anthesis day or 1, 2, or 3 days after anthesis (Pollination time). Flowers were collected 1, 2, or 3 days after pollination (Collection time). Response variables were: the number of pollen grains counted on the surface of the stigma and the position of the furthermost pollen tube tip within the pistil.
Table 3. Results from the second experiment. Assesment of pollen grains number on stigma after clearing and staining with aniline blue and the furthermost pollen tube tip position in pistil in samples collected at a different time in relation to anthesis and on a different number of days after pollination. Pooled data of SM 1219–1 crossed with HMC-1 or self-pollinated. A total of 60 flowers (180 ovules) were analyzeda.
Table 4. Relevant results from Experiment 3. Analysis of variance and proportion for the presence of pollen tube growth (a) after controlled pollinations in three cassava female parents: SM 1219-9, MNga 11 and MCol 1505. A total of 210 pistils (630 ovules) were analyzed. The source of pollen was the same three genotypes. Pollinated pistils were harvested at seven different times ranging from 6 to 74 h after pollination (HAP).
Table 5. Analysis of variance and relevant averages for pollen tube growth in controlled pollinations in 14 cassava female parents in Experiment 4. A total of 108 pistils (324 ovules) were analyzed in this study. Pollinations were made using three male progenitors. In one case the tag identifying the source of pollen was missing. Pistils were harvested at four different times ranging from 16 to 96 h after pollination (HAP).
Table 6. Analysis of variance and relevant averages for pollen tube growth in controlled pollinations in crosses between 11 female and 6 male cassava progenitors in Experiment 5. A total of 210 pistils (630 ovules) were analyzed in this study. Pistils were harvested at 72 or 96 h after pollination (HAP).
Table 7. Average depth of pollen tube growth in the pistils of 11 female cassava progenitors and 6 male progenitors (across two harvesting times: 72 and 96 h after pollination) from Experiment 6.