Figures & data
Figure 1. Plots of population growth rn for n = 10 from a single initial cell as functions of environmental lethality b under different assumptions. Pink, blue and purple curves show the effect of decreasing resource levels on the rate of population collapse as lethality increases. Light and dark green curves show relative stability of fully (β = 0) or partially (β = 0.4) protected populations at different levels of resource-use efficiency.
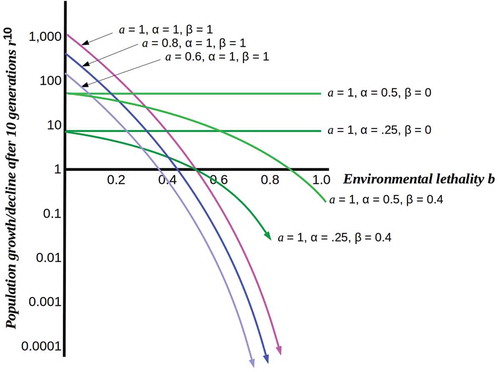
Figure 2. Interaction between an environment E and an embedded cell C. The functions V and P specify environmental variation and cellular predictions, respectively.
Figure 3. a) The theory of active inference postulates that systems challenged by high environmental free energy respond either by updating their prior probability distributions or world models, or by altering their posterior probability distributions by acting on the world so as to change its effects on them. b) Reproductive cells challenged by environmental lethality can be expected either to update their prior probability distributions by altering their genomes, or to execute some behavior that changes their environment’s lethality. Genome modification by rapid evolution or lateral gene transfer is primarily a prokaryotic strategy. Motility is a successful, primarily eukaryotic strategy when environmental lethality varies over short ranges. Building a multicellular structure, a body, that protects reproductive cells from the environment provides a solution when escape is not possible.
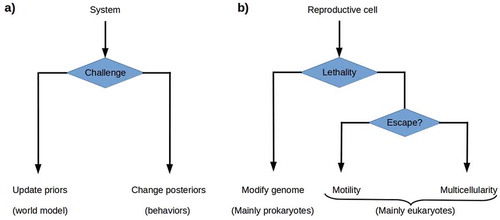
Figure 4. Adding a buffer between C and E by reproducing a copy C’ of C. Competition for reproduction-enabling resources is eliminated C’ if reproductively disabled.
Figure 5. Typical model simulation runs under different conditions. The simulation depicts an environment varying in lethality from 0% (b = 0, black, left margin) to 100% (b = 1.0, red, right margin). Stem cells (green) are randomly seeded in this environment at a density of 5% and allowed to reproduce for 120 division cycles. Neighboring stem cells compete for reproductive resources. Somatic progeny (blue) protect their nearest-neighboring cells, whether these are stem or other somatic cells. a) Stem cells alone cannot invade the higher-lethality half of the environment, even with optimal reproductive resources (a = 1.0). Here neighboring stem cells suffer a 20% resource reduction (α = 0.8) due to competition; removing this reduction does not allow them to cross the 50% lethality boundary. b) Moderately (50%, i.e. β’ = 0.5) protective but relatively long-lived (50% resistance to lethality) somatic cells allow mainly small colonies in the moderately-lethal (50% – 75%) sector of the environment (a = 0.8, probability of somatic-cell progeny 50%). c) Fully (100%, β’ = 0) protective but shorter-lived (only 20% resistance to lethality) somatic cells allow larger colonies to populate even the high-lethality (75% – 100%) sector of the environment (a = 0.8, probability of somatic-cell progeny 50%). d) Fully-protective and relatively long-lived (50% resistance to lethality) somatic cells allow invasion of the lethal sector of the environment (a = 1.0, probability of somatic-cell progeny 25%).
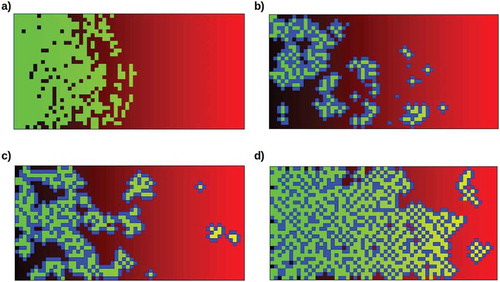
Figure 6. Increasing occupation of the high-lethality (b > 0.5) half of the environment as the somatic cell protection factor 1 – β is increased from 0.0 to 1.0, with all other parameters as in . Filled circles show averages over 10 runs with random starting populations; bars show full range of results obtained.
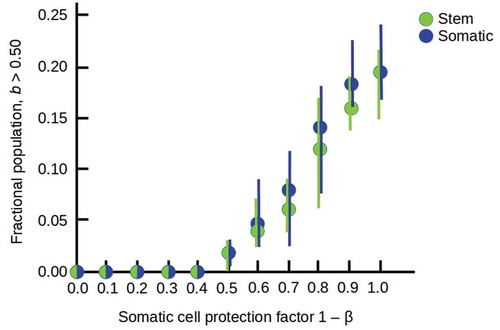
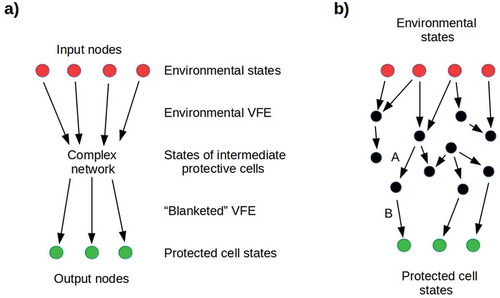
Figure 7. a) Simplified representation of a Markov blanket. Input nodes represent environmental states that transmit environmental VFE to a network of intermediate nodes, with conditional dependencies specified by a connectivity matrix Mij. Output nodes represent protected cell states that receive the “blanketed” VFE. It is natural to interpret distinct input nodes as transmitting the VFE of different dimensions of the environment, e.g. pathogenicity or toxicity. b) A network very near its percolation threshold: removing either link A or B results in opacity. On the other hand, adding any downward-going link between black nodes, or between black and green nodes, increases the cell’s exposure to its environment.