
Figures & data
Figure 1. Abundances and adaptive evolution of colonizing E. coli. (a) Bacterial loads per gram of feces of the invader and resident E. coli in old (red symbol, n = 9) and in young mice (gray symbol, n = 7). Each symbol represents the average bacterial loads per gram of feces of each mouse (at least 3 measurements); (b) Temporal dynamics of the frequency of the YFP-labeled E. coli populations evolving in old animals (n = 9). The error bars represent the ±2*SEM.
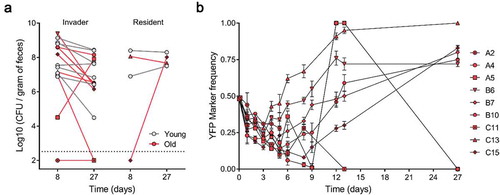
Table 1. Evolutionary changes detected in the invader Escherichia coli after colonization of old mice for 27 d.
Table 2. Evolutionary changes detected in the invader Escherichia coli colonizing young mice. The adaptive mutations observed across independently evolved population of E. coli after 27 d of streptomycin in young mice [Citation6] (see also materials and methods).
Figure 2. Mutation accumulation and Horizontal Gene Transfer in E. coli. (a) Frequency of the mutations specific to the young (n = 7) in gray, old (n = 6, mouse A4, A5, B6, B7, B10, C13) in red, and common to both age groups in black; (b) Bacteriophage-mediated HGT detected in young (n = 2) and old (n = 2) mice. Nef and KingRac bacteriophages were typed in 20 clones at d 2 and 8 and in a pool of >1000 clones at d 27; (c) Total number of mutations, (d) IS mutations, (e) intergenic mutations, (f) synonymous mutations, (g) coding mutations, and (h) insertion/deletion mutations detected in E. coli populations evolved in young (n = 7) and old (n = 6) mice 27 d post-colonization. For all boxplots, the line inside the box indicates the median, the lower and upper box boundaries indicate the 25th and 75th percentile, respectively, and the whiskers range from the minimum to the maximum value.
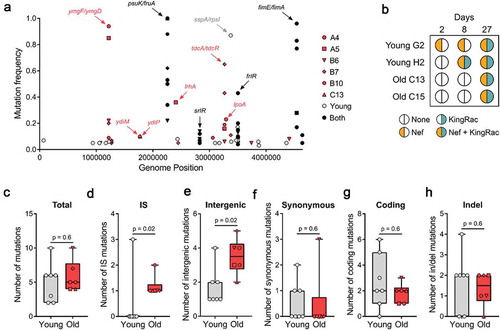
Table 3. Putative phages predicted within the assembled genome of the resident E. coli. Predictions were attained using Phaster.