
Figures & data
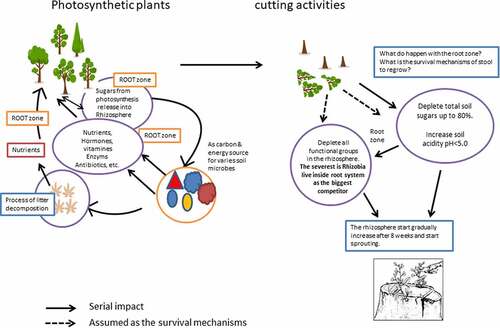
Table 1. Summary of ANOVA analysis (p-value) on the influence of tree-cutting on the total soil sugars and microbial communities in the rhizosphere*
Figure 1. Dynamic of total soil sugar (TSS) in C. calothyrsus stump rhizosphere. The TSS contents reduce drastically a week after felling and continually deplete until the 4th week. All cutting treatments show, the TSS start increasing in the 8th week after felling. The TSS contents of the uncut group remain stable during the experiment. (Solid line: uncut trees; dotted line: cut trees).
Figure 2. Dynamic of soil acidity in C. calothyrsus stump rhizosphere. All cut treatments show the soil pH immediately decreased a week after felling, except the group of 12 month age, the lowest pH happen at the 2nd week after felling. The rhizosphere pH then gradually increased until at the 12th week after cutting closer to the initial situation. There is no fluctuation in the soil acidity of the uncut treatments during the observations. (Solid line: uncut trees; dotted line: cut trees).
Figure 3. Microbes behavior in rhizosphere after cutting; (a) Phosphate solubilizer (PS), (b) Cellulose Microbes (CMC), (c) Biological Nitrogen Fixation – Free Living (BNF-FL), (d) Effective nodule represented by rhizobia. All functional groups population deplete a week after felling. The least affected is cellulose degrader (CMC) (Figure 3(a)) while the most impacted is rhizobia which are colonized in the root nodules (Figure 3(d)). (Solid line: uncut trees; dotted line: cut trees).
Table 3. Diminution of the soil-microbe population in the rhizosphere of stumps compared to that in uncut stands of a similar age (%)*
Table 2. Percentage of TSS depletion due to tree cutting