Figures & data
Figure 1. Revision by KMLS (Kyocera Modular Limb Salvage System). (a) X-ray. (b) Intraoperative picture. (c) Soft tissue adjacent to metal surface.
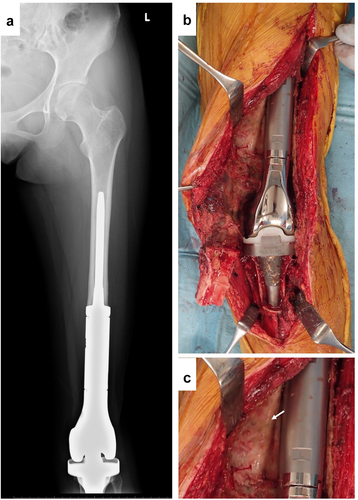
Figure 2. Revision by HMRS (Howmedica Modular Resection System). (a) Apical view of X-ray showing stem fracture. (b) lateral view of X-ray showing stem fracture. (c) Intraoperative picture. (d) Appearance following peeling away of thin, soft tissue. (e) Appearance following detachment of connective tissues.
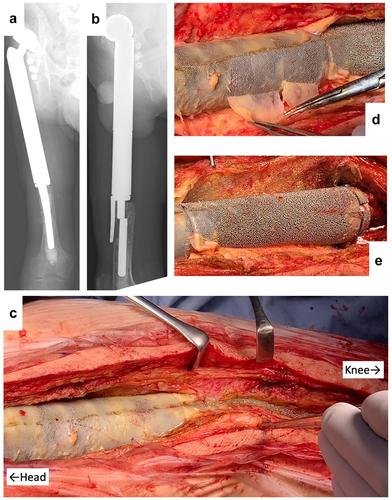
Figure 3. Wide resection of re-recurrent chest wall MPNST (malignant peripheral nerve sheath tumors). (a) Computed tomography of recurrent chest wall MPNST, T indicates tumor; M indicates mesh. (b) Intraoperative picture. (c) Micrograph of hematoxylin–eosin (HE)-stained section; ×40 image. (d) Micrograph of Masson’s trichrome-stained section. Red color indicates muscle tissues. (e) Micrograph of HE-stained section; ×100 image. The brown line indicates ePTFE; the aligned white defects under the ePTFE are the polypropylene mesh. (f) Micrograph of Masson’s trichrome-stained section.
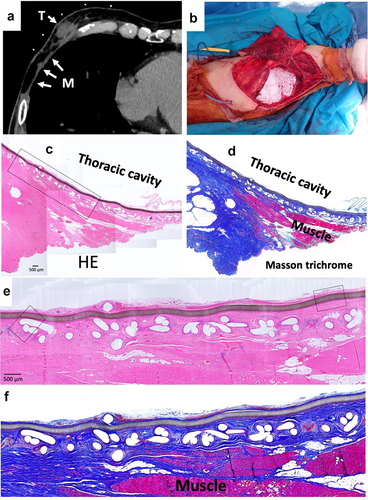
Figure 4. Histology of revision by KMLS. (a) Micrograph of hematoxylin–eosin (HE)-stained section; ×40 image. (b) Micrograph of Masson’s trichrome-stained section. Red color indicates muscle tissues. (c) Micrograph of hematoxylin–eosin (HE)-stained section; ×100 image. (d) Micrograph of Masson’s trichrome-stained section; ×100 image. (e) Micrograph of section with immunohistochemical (IHC) staining for CD68; ×100 image. (f) Micrograph of section with IHC staining for vimentin; ×100 image. (g) Micrograph of section with IHC staining for collagen type I; ×100 image. (h) Micrograph of HE-stained section; ×400 image. (i) Micrograph of Masson’s trichrome-stained section; ×400 image. (j) Micrograph of section with IHC staining for CD68; ×400 image. (k) Micrograph of section with IHC staining for vimentin; ×400 image.
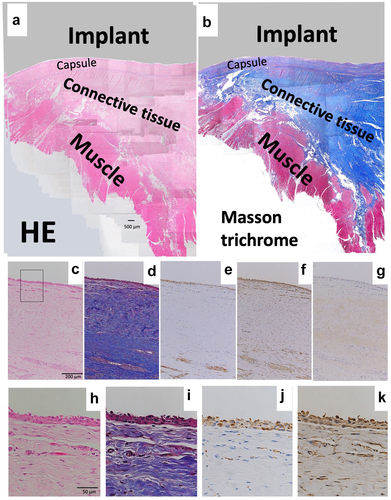
Figure 5. Histology of revision by HMRS. (a) Micrograph of hematoxylin–eosin (HE)-stained section; ×40 image. Arrow indicates metal process of HMRS, (b) Micrograph of Masson’s trichrome-stained section. (c) Micrograph of section with immunohistochemical (IHC) staining for CD68; ×100 image. (d) Micrograph of section with IHC staining for vimentin; ×100 image. (e) Micrograph of section with IHC staining for collagen type I; ×100 image. (f) Micrograph of HE-stained section; ×200 image. (g) Micrograph of Masson’s trichrome-stained section; ×200 image. (h) Micrograph of section with IHC staining for CD68; ×200 image. (i) Micrograph of section with IHC staining for vimentin; ×200 image. (j) Micrograph of HE-stained section; ×200 image. (k) Micrograph of Masson’s trichrome-stained section; ×200 image. (l) Micrograph of section with IHC staining for CD68; ×200 image. (m) Micrograph of section with IHC staining for vimentin; ×200 image.
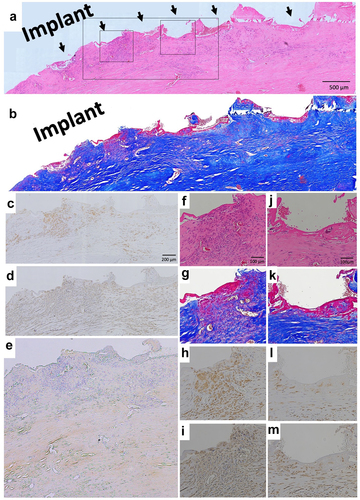
Figure 6. Histology of wide resection with mesh. (a) Micrograph of hematoxylin–eosin (HE) -stained section around ePTFE (expanded polytetrafluorethylene); ×200 image. (b) Micrograph of section with immunohistochemical (IHC) staining for CD68 around ePTFE; ×200 image. (c) Micrograph of section with IHC staining for vimentin around ePTFE; ×200 image. (d) Micrograph of section with IHC staining for collagen type I around ePTFE; ×200 image.
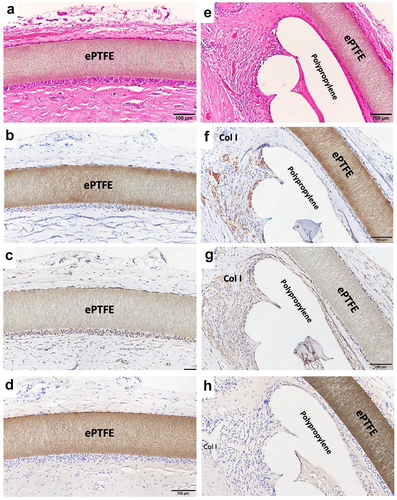
Figure 7. Immunohistochemical staining for S100A4. (a) Micrograph of tissue from revision by KMLS. The square indicates the counted HPF. The numbers of S100A4-positive cells are shown. (b) Micrograph of tissue from revision by HMRS. The numbers of S100A4-positive cells are shown. (c) Micrograph of tissue from wide resection with mesh. The numbers of S100A4-positive cells are shown.
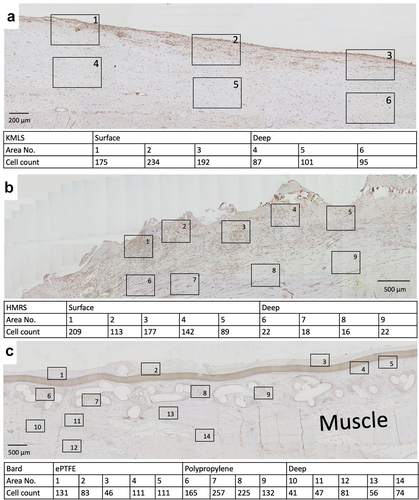
Figure 8. Assessment of S100A4-positive cell accumulation. Averages at the surface of KMLS, surface of HMRS, surface of ePTFE, surface of polypropylene, and their deep areas are shown.