
Figures & data
Figure 1. Sample EEG signal from each set A, B, C, D and E.
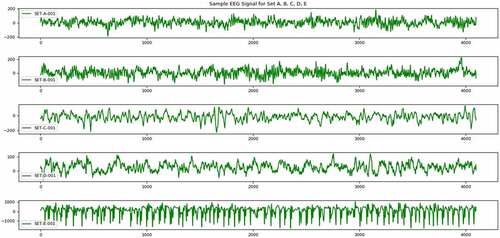
Figure 2. Sample EEG signal from each set A, B, C and D after decomposition using DWT.
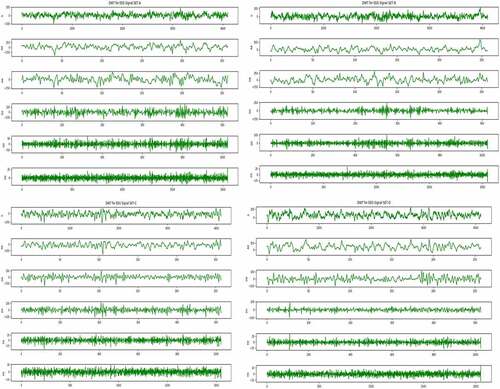
Figure 3. Sample EEG signal from set E after decomposition using DWT.
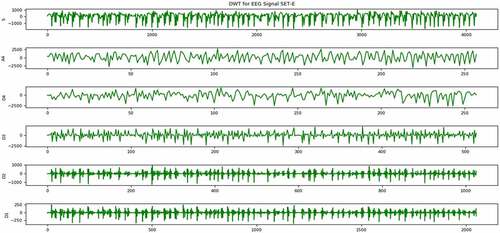
Figure 4. Architecture of proposed model (DMELM).
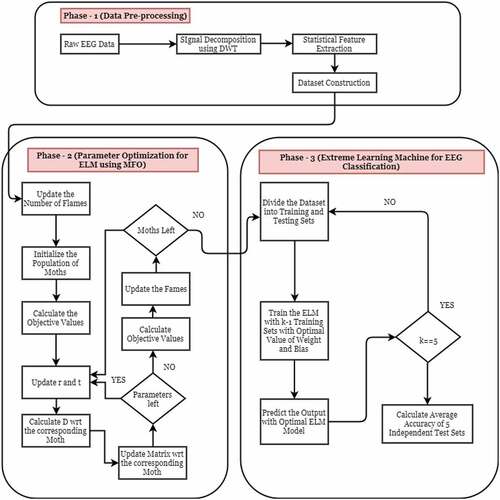
Figure 5. Accuracy comparison of different Afs for SET 1, 2, and 3 using ELM.
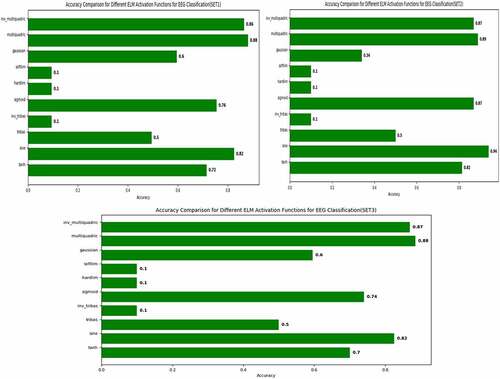
Table 1. Parameter setup for different techniques used.
Table 2. Accuracy comparison for different activation functions for SET 1, 2 and 3 using ELM.
Figure 6. Validation curve for EEG signal classification using DM- Extreme Learning Machine (ELM) with three different categories of dataset (Set1, Set2 and Set3).
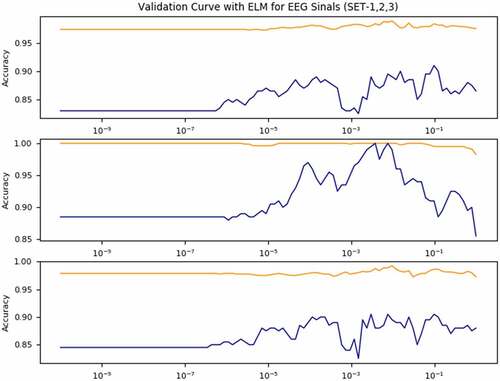
Table 3. Performance comparison for different machine learning techniques for SET1.
Table 4. Performance comparison for different machine learning techniques for SET2.
Table 5. Performance comparison for different machine learning techniques for SET3.