Figures & data
Figure 1. The febrile response to intraperitoneal and intravenous injection of lipopolysaccharide. a. Biphasic fever after intraperitoneal injection of 120 μg/kg LPS (blue trace). Arrowhead points at the handling stress induced hyperthermia and arrows at the two fever phases. b. Polyphasic fever after intravenous injection of 30 μg/kg LPS. Asterisk indicates 1st phase of fever, and arrows point at the 2nd and 3rd phases, respectively. Green trace in a and b shows the response to saline injection. Injections were done at time point zero. The response to LPS and saline is compiled from a series of 13 and 20 mice, respectively, in a, and 9 and 6 mice, respectively, in b.
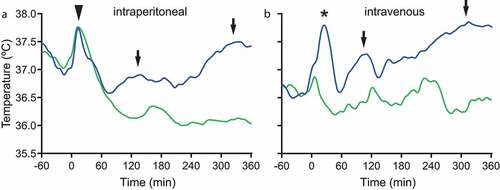
Figure 2. Fever in mice with cyclooxygenase-2 deletion in myeloid cells. WT mice and COX-2LysMCre mice show similar febrile responses to i.v. injection of 30 μg/kg LPS.
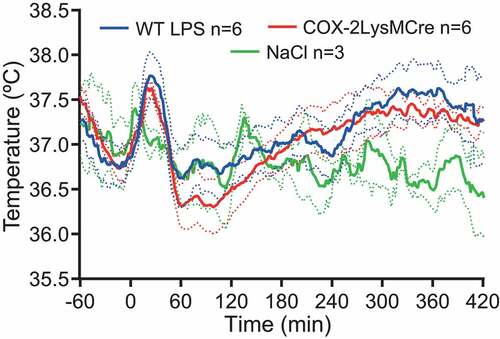
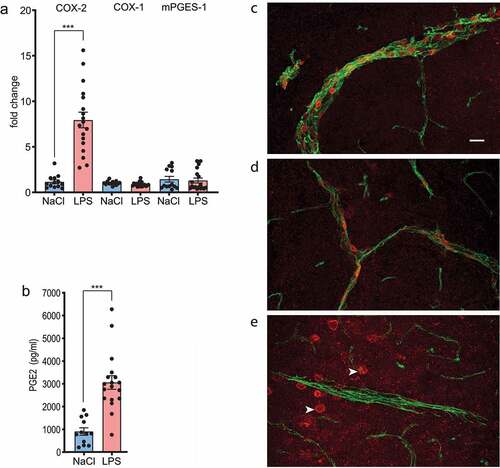
Figure 3. Prostaglandin synthesis in the brain during the initial febrile response to i.v. injection of LPS. a. Induced expression of Cox-2 mRNA, but not of Cox-1 or mPGES-1 mRNA in the hypothalamus 30 min after injection. b. PGE2 levels in the cerebrospinal fluid 30 min after injection. Error bars = SEM. *** P < 0.001 (unpaired t-test). c-e. Confocal micrographs showing induced Cox-2 immunoreactivity (red) in large (c) and small (d) blood vessels, stained for the endothelial cell marker CD31 (green), 30 min after LPS injection. After saline injection (e), there was no Cox-2 in the blood vessels, however, staining of cortical neurons (arrowheads) was seen, demonstrating method accuracy. Scale bar = 20 μm.