145
Views
0
CrossRef citations to date
0
Altmetric
Short Communication

Inter-turn intervals in Paramecium caudatum display an exponential distribution

ORCID Icon, , ORCID Icon & ORCID Icon
Article: 2360961 | Received 10 Apr 2024, Accepted 24 May 2024, Published online: 31 May 2024

Figures & data

Figure 1. Distributions of inter-turn intervals. The smoothed inverse frequency distributions (in black) of inter-turn intervals, with 3 models fitting the distribution: Power law (pink), Exponential (green), Stretched Exponential (blue). The observed data have been smoothed using symmetric Gaussian smoothing, but the curve-fitting was based on the raw, unsmoothed data. The x- and y-axis measures are on a log scale. The inset figures shows the binned frequency distributions of inter-turn intervals.

Figure 1. Distributions of inter-turn intervals. The smoothed inverse frequency distributions (in black) of inter-turn intervals, with 3 models fitting the distribution: Power law (pink), Exponential (green), Stretched Exponential (blue). The observed data have been smoothed using symmetric Gaussian smoothing, but the curve-fitting was based on the raw, unsmoothed data. The x- and y-axis measures are on a log scale. The inset figures shows the binned frequency distributions of inter-turn intervals.

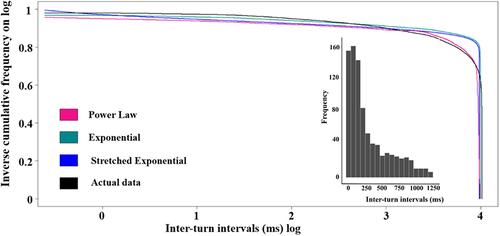
Table 1. The performance of curve fits of inter-turn intervals. AIC = Akaike Information Criterion. Curve fits were performed using the maximum-likelihood method on the inverse cumulative distribution.

Supplemental material

Supplemental Material

Download Zip (42.8 KB)