Figures & data
Figure 1. Example of shoe worn.

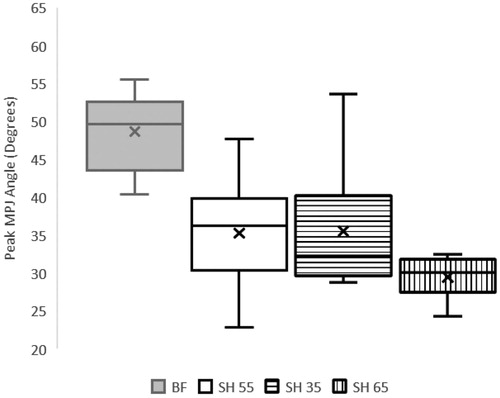
Figure 2. Distribution of peak MPJ flexion angles by condition (BF, SH55, SH35 and SH65) during propulsion. The cross within the box represents mean group MPJ flexion angle. The solid line represents group median value. Error bars illustrate upper and lower extremes.