
Figures & data
Table 1. Characteristics of participants (n = 18) and shoes worn by participants.
Figure 1. Overall study design (left diagram) and experimental process for each shoe (right diagram). ^FLAT and VP4 only. Abbreviations. FLAT, Saucony Endorphin Racer 2 racing flat. IMU, inertial measurement unit. OWN, own habitual running shoe. RUN-CAT, running shoe comfort assessment tool. VAS, visual analogue scale. VP4, Nike Vaporfly 4%.
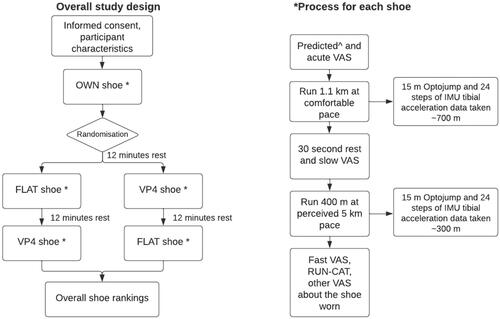
Table 2. Variables (mean ± standard deviation) collected from the 1.1 km trial at a self-selected comfortable pace (slower) and a 400 m trial at a perceived 5 km pace (faster) ran by participants (n = 18).
Table 3. Visual analogue scale (0–100 mm scale, mean ± standard deviation) scores on comfort, shoe properties, and overall running experience of participants (n = 18).
Table 4. Ranking of shoes by participants (n = 18) values are count (percentage %).
Table 5. Repeated measures correlations between comfort measures and subjective and biomechanical measures of data from 18 participants.
Supplemental Material
Download MS Word (453.5 KB)Data availability statement
The data that support the findings of this study are openly available in OSF at http://doi.org/10.17605/OSF.IO/A64N5 (Hébert-Losier, Citation2023).