
Figures & data
Figure 1. Operating principle of Shape Inversion GAN for shape completion (Zhang et al., Citation2021).
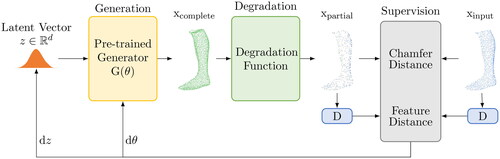
Figure 2. Operating principle of PoinTr for shape completion (Yu et al., Citation2021).
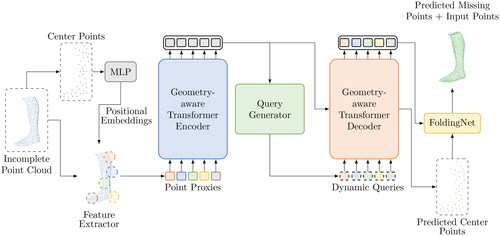
Figure 3. Operating principle of VRCNet for shape completion (L. Pan et al., Citation2021).
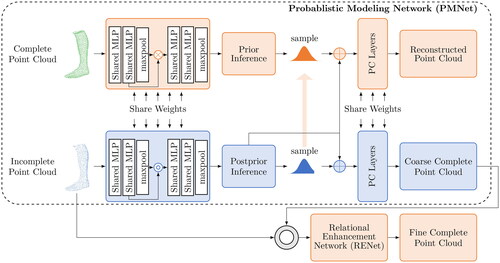
Figure 4. Operating principle of SnowflakeNet for shape completion (Xiang et al., Citation2021).
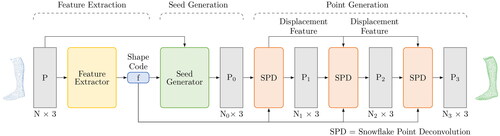
Figure 5. Operating principle of PointAttN for shape completion (J. Wang et al., Citation2022).
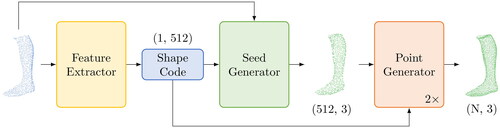
Figure 6. Baseline feet created from all feet of the training dataset.
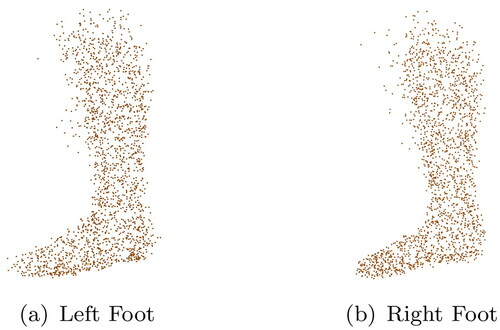
Figure 7. Example point cloud from the training dataset.
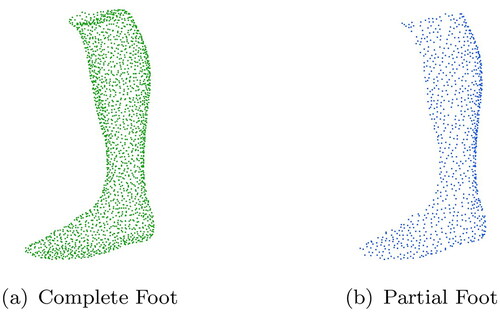
Table 2. Quantitative results for all networks.
Figure 8. Qualitative results of three point cloud completions from the different networks. Each row shows a different foot from the corpus.e dataset from two different views. The first column (ground truth (GT)) shows the best possible result of the reconstruction. The second column (input) displays what the network gets as a starting point for the reconstruction. The third column shows the baseline model, which represents an average foot. The following columns show the reconstructions of the different networks from the respective input.
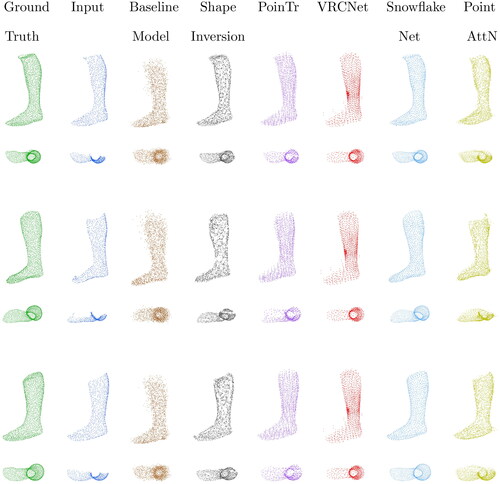
Figure 9. Results of all metrics for each of the networks tested.
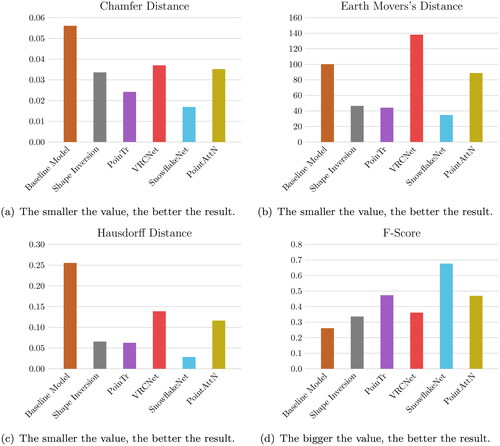
Table 1. Hyperparameters for Shape Inversion (Zhang et al., Citation2021), PoinTr (Yu et al., Citation2021), VRCNet (L. Pan et al., Citation2021), SnowflakeNet (Xiang et al., Citation2021) and PointAttN (J. Wang et al., Citation2022).