
Figures & data
Figure 1. Force-deformation curves of the mechanical tests (A,D), test setup (B,E), carbon plates (C), and marker set (F). D: full line resembles shoe eversion, dashed line shoe inversion.
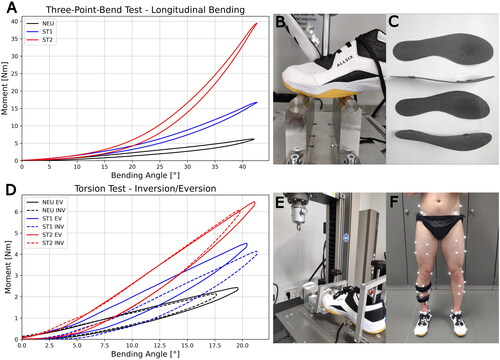
Table 1. Mechanical testing results for all shoe conditions.
Figure 2. Illustrations of the different jump-cut movements.
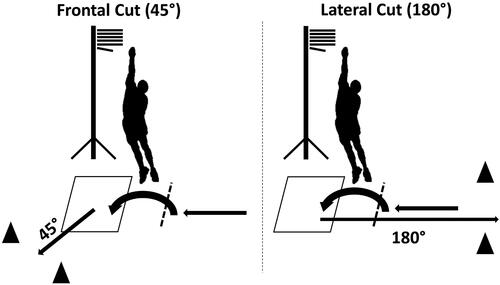
Table 2. The mean kinematic and kinetic parameters, along with their standard deviations, computed for all cutting movements and shoe conditions.
Figure 3. Ankle inversion during ground contact for frontal (A) and lateral cuts (B). The bold lines represent average values, while shaded areas show standard deviations. Solid lines below the data illustrate results of the SPM analysis and indicate the time points where the threshold for significance was met. The grey area represents inter-subject repeated measure ANOVA among the three shoe conditions NEU, ST1, ST2 (p < 0.05). The red, blue, and magenta areas indicate post-hoc paired t-tests between shoe conditions (p < 0.05/n-tests).
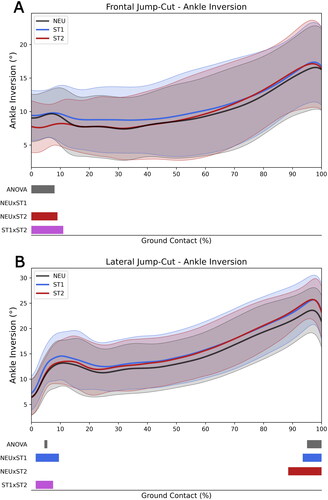
Figure 4. Paired plots of maximum ankle inversion (A,B) and forefoot inversion (C,D) during frontal (FC) and lateral cut (LC) across all four conditions. The ‘*’ symbol marks a significant difference compared to the NEU condition. Each line graph represents an individual participant. Green lines connecting conditions signify an increase in maximum angle, while red lines indicate a decrease.
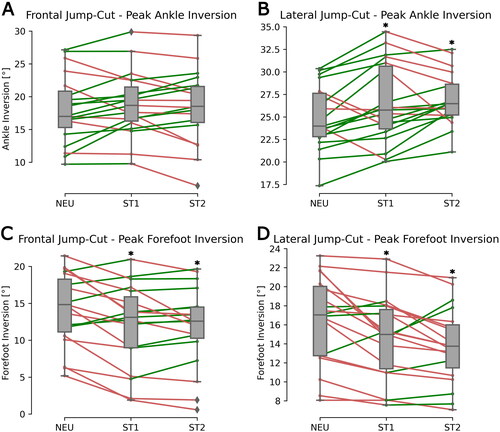
Figure 5. Forefoot inversion during ground contact for frontal (A) and lateral cuts (B). The bold lines represent average values, while shaded areas show standard deviations. Solid lines below the data illustrate results of the SPM analysis and indicate the time points where the threshold for significance was met. The grey area represents inter-subject repeated measure ANOVA among the three shoe conditions NEU, ST1, ST2 (p < 0.05). The red, blue, and magenta areas indicate post-hoc paired t-tests between shoe conditions (p < 0.05/n-tests).
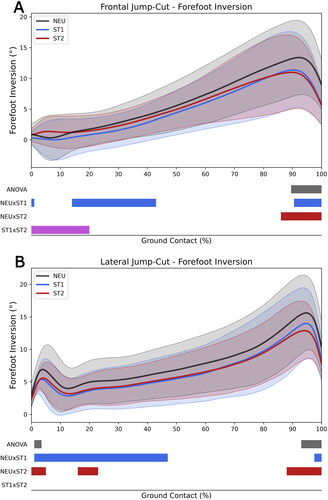
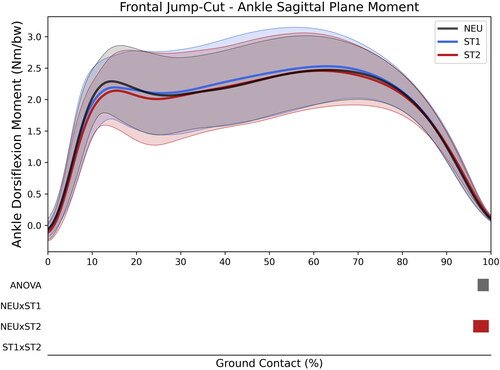
Figure 6. External dorsiflexion moment during ground contact for the frontal cut. The bold lines represent average values, while shaded areas show standard deviations. Solid lines below the data illustrate results of the SPM analysis and indicate the time points where the threshold for significance was met. The grey area represents inter-subject repeated measure ANOVA among three shoe conditions (NEU, ST1, ST2), while the yellow area includes the BF condition (both p < 0.05). The red, blue, and magenta areas indicate post-hoc paired t-tests between shoe conditions (p < 0.05/n-tests).