Figures & data
FIGURE 1. Map of the Florida Keys coral reef tract. Reef strata are described in .
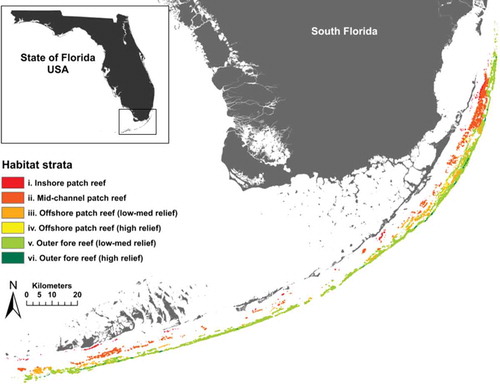
TABLE 1. Physical and biological habitat characteristics of primary sampling units (PSUs) during 2003–2011. Abbreviations are as follows: n = the number of PSUs sampled, min = the minimum value, max = the maximum value, and avg = the mean value.
TABLE 2. Variable inclusion probabilities and coefficient means for Red Grouper statistical models. Asterisks indicate variables included in resource selection functions; values in parentheses are standard errors; na = not applicable.
FIGURE 2. Goodness-of-fit plots for Red Grouper resource selection functions. Shown are the observed and replicated discrepancy measures calculated from the squared Pearson residuals for each binomial model formulation.
FIGURE 3. Intercept odds ratios of Red Grouper occurrence in each reef stratum. Odds ratios were calculated relative to reference stratum i, defined as low–medium relief inshore patch reefs. The circles denote means, and the lines are centered 95% confidence intervals.
TABLE 3. Variable inclusion probabilities and coefficient means for Black Grouper statistical models. Asterisks indicate variables included in resource selection functions; values in parentheses are standard errors; na = not applicable.
FIGURE 4. (A) Red Grouper responses to maximum vertical relief from the occurrence submodel () and (B) the observation submodel (p). The solid (1) and dashed (2) lines correspond to the logistic regression and site occupancy formulations, respectively.
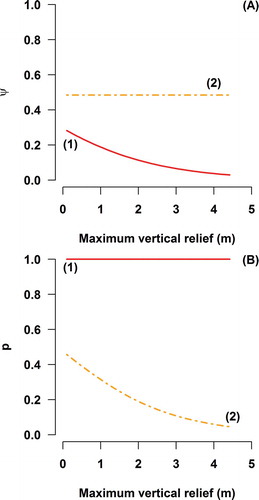
FIGURE 5. Black Grouper responses to (A) latitude and (B) maximum vertical relief from the occurrence submodel () and (C) vertical relief from observation submodel (p). The solid (1) and dashed (2) lines correspond to the logistic regression and site occupancy formulations, respectively.
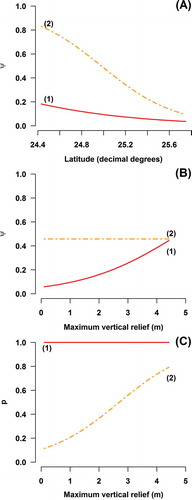
FIGURE 6. Conditional responses in Black Grouper occurrence probability () to depth within each reef stratum for the logistic regression and site occupancy model formulations. Reef strata (i–vi) are described in . Only reef strata with statistically significant slope coefficients are shown.