Figures & data
FIGURE 1. Map of the Altamaha River watershed, Georgia with inset showing relative location within the USA. Unique receiver station locations are represented by filled circles. Dams delineate the upper boundary of habitat accessible to Atlantic Sturgeon in the Ocmulgee and Oconee River tributaries. Maximum upstream detections of Atlantic Sturgeon in both tributaries and other relevant river kilometer (rkm) locations are indicated.
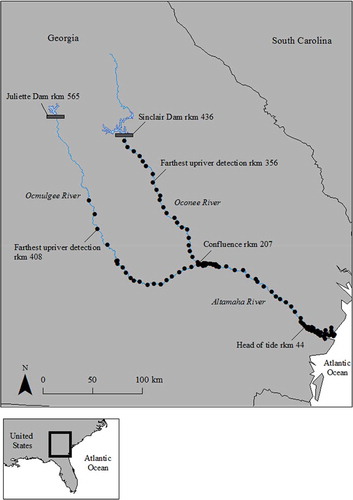
TABLE 1. Data associated with 42 adult Atlantic Sturgeon caught and tagged with sonic transmitters in the Altamaha River, Georgia, April 1, 2011 to March 31, 2014. Putative spawning migrations indicating spring two-step migration (S), fall one-step migration (F), or no observed migration (N), migration being defined as directed upstream movements of more than 160 km during a single year of the study.
FIGURE 2. General representation of putative (a) spring two-step and (b) fall one-step spawning migrations of Atlantic Sturgeon in the Altamaha River system, Georgia. Pie charts show prevalence of each migration strategy documented using acoustic telemetry from study year 1 (April 1, 2011 to January 31, 2012), year 2 (April 1, 2012 to January 31, 2013), and year 3 (April 1, 2013 to January 31, 2014).
FIGURE 3. Box plots of mean weekly locations of Atlantic Sturgeon that made spring two-step migrations in the Altamaha River system, Georgia, where the box ends = 25th and 75th percentiles of ultrasonic tag detections, the line within box = median, error bars (whiskers) = minimum and maximum river kilometer (rkm) detections, and the number above the error bar = number of individual fish represented. Dashed lines denote head of tide at rkm 44 and the confluence at rkm 207. Mean weekly water temperature is from LTER GCE-7 mooring in the lower Altamaha River.
FIGURE 4. Box plots of mean weekly locations of Atlantic Sturgeon that made fall one-step migrations in the Altamaha River system, Georgia, as explained in .