Figures & data
FIGURE 1. Location of the South Padre Island Artificial Reef (PS-1047), 11.3-km east of Port Mansfield, Texas, showing the 13 sampling locations for standard monitoring units for the recruitment of juvenile reef fish (SMURFs) and scuba surveys. Samples were collected from locations within four culvert-density categories (see ).
FIGURE 2. Side-scan sonar images of the four culvert density categories within a 30-m radius: (A) category 0 = zero culverts, (B) category 1 = 1–50 culverts, (C) category 2 = 51–100 culverts, and (D) category 3 ≥ 101 culverts.
FIGURE 3. Standard monitoring unit for the recruitment of juvenile reef fish (SMURF), including two replica coral pieces mounted to a 30.5-cm2 cement block and covered with plastic netting with grid sizes 2.54 cm2. Photo courtesy of Seth Patterson.
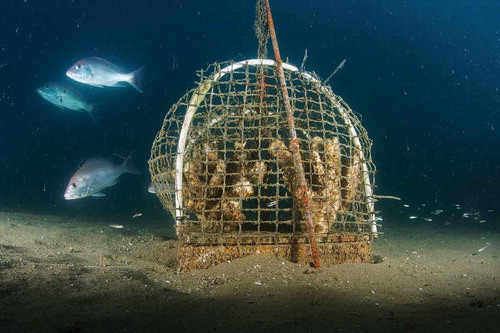
TABLE 1. Days deployment by year and month of standardized monitoring units for the recruitment of reef fish (SMURFs) by location and culvert density category within a 30-m radius: 0 = zero culverts, 1 = 1–50 culverts, 2 = 51–100 culverts, and 3 ≥ 101 culverts. Asterisks indicate sample was retrieved after more than 150 d of deployment and only used in species presence–absence comparisons.
TABLE 2. Fish collections data from standard monitoring units for the recruitment of reef fish (SMURFs) from June 2013 to July 2014 from 13 different sampling locations at the artificial reef (PS-1047) off Port Mansfield, Texas. Whether the species was also observed as a juvenile or an adult during the concurrent visual scuba surveys is noted, but species only observed in scuba surveys are not listed.
FIGURE 4. Average (+1 SE) (A) species richness (S), (B) abundance (N, number of fish per culvert category), (C) species evenness (J′), and (D) species diversity (H′) of all juvenile fish collected (including Tomtate) by SMURFs (standard monitoring units for the recruitment of juvenile reef fish) at the four culvert categories (see ). No significant differences were observed.
FIGURE 5. Average (+1 SE) (A) species richness (S), (B) abundance (N, number of fish per culvert category), (C) species evenness (J′), and (D) species diversity (H′) for all juvenile fish collected (excluding Tomtate) by SMURFs (standard monitoring units for the recruitment of juvenile reef fish) at the four culvert categories (see ). Asterisks denote significance at P < 0.05.
TABLE 3. PERMANOVA pairwise comparisons of culvert categories and juvenile fish compositions (excluding Tomtate, i.e., “minus H. aurolineatum” data set) from standard monitoring units for the recruitment of reef fish (SMURFs; see for culvert categories). Asterisks denote significance at P < 0.05.
FIGURE 6. Nonmetric multidimensional scaling (NMDS) ordination plot of juvenile species compositions, sampled by SMURFs (standard monitoring units for the recruitment of juvenile reef fish), based on culvert densities (see ). The two-dimensional stress value presented in the upper right hand corner represents the accuracy of the NMDS plot. The closer two points are to each other the more similar their species compositions.
TABLE 4. Top four dominant juvenile fish species collected from standard monitoring units for the recruitment of reef fish (SMURFs) at each culvert category (see ). Similarity Percentages Test (SIMPER) of the highest contributing species to community composition similarity among all sites in each category is given by percentage values in parentheses. The analysis did not include Tomtate (i.e., “minus H. aurolineatum” data set) because this species arrived in heavy pulses only in June and July of 2013 and 2014.
FIGURE 7. Principal components analysis (PCA), showing four environmental variables as ordination vectors. (A) PC1 accounts for 57.7% of variation among rugosity, vertical relief, and percent cover. PC2 accounts for 24.9% of variation in average monthly temperature. (B) PCA showing the location of 31 sampling efforts from June 2013 to July 2014, based on culvert category (see ) and different fish species sampled by SMURFs (standard monitoring units for the recruitment of juvenile reef fish), in relation to the environmental variables. PC values and variables are the same for both panels A and B. Juvenile fish species shown include dominant and commercially important species among the categories.
TABLE 5. Average (±SE) diversity indices (S, N, J′, H′) of the juvenile population sampled by standard monitoring units for the recruitment of reef fish (SMURFs) from June 2013 to July 2014 and the adult and juvenile populations sampled concurrently via visual scuba surveys.
TABLE 6. Similarity percentages test (SIMPER) showing top 10 species dissimilarity between the juvenile SMURF (standard monitoring units for the recruitment of reef fish) and the concurrent adult scuba sampling of fish communities. Total dissimilarity between the two populations was 85.1%. The contribution percentage indicates each species’ contribution to the overall 85.1% dissimilarity between the two communities.
FIGURE 8. Nonmetric multidimensional scaling (NMDS) ordination plot of the adult and juvenile fish communities from all sample locations in the study period. Adult fish communities were sampled via visual scuba surveys while juvenile fish communities were sampled with SMURFs (standard monitoring units for the recruitment of juvenile reef fish). Comparisons were made at the same sampling locations in the reef. Numbers 0–3 represent the four culvert-densities categories (see ). Three significant groupings of species composition are seen at the 40% species similarity level. The two-dimensional stress value presented in the upper right hand corner represents the accuracy of the NMDS plot. The closer two points are to each other, the more similar their species compositions.