Figures & data
FIGURE 1. Annual trends of the (a) total catch and (b) percentage of Grey Mullet caught using purse seiners, gill nets, trail nets, and set nets and (c) the effort and CPUE of Grey Mullet caught using purse seiners in the Taiwan Strait.
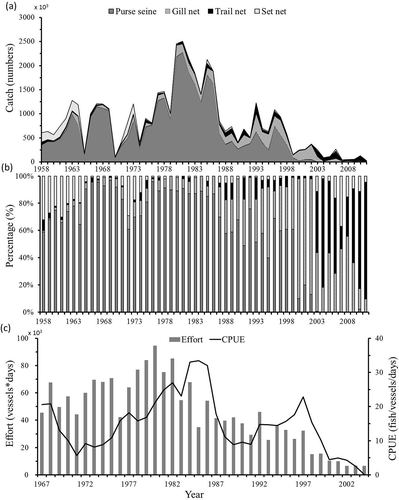
TABLE 1. Length–age composition data of Grey Mullet in the Taiwan Strait.
TABLE 2. Input parameters used for estimating the instantaneous rate of natural mortality for Grey Mullet in the Taiwan Strait.
FIGURE 2. Annual changes in population (black bars) and fishing mortality (gray line) for Grey Mullet in the Taiwan Strait, 1958–2004.
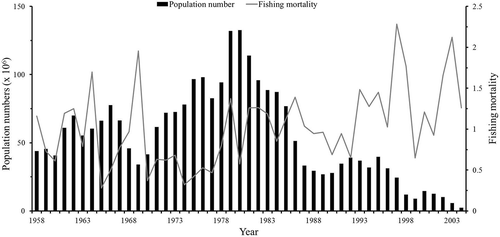
FIGURE 3. Relationships between (a)–(e) the CPUE and population, (f)–(j) population and fishing mortality, and (k)–(o) SSTA and recruitment numbers (ages 2–3) of Grey Mullet caught with varying M (0.50M, 0.75M, 1.00M, 1.25M, and 1.50M) in the Taiwan Strait, 1958–2003.
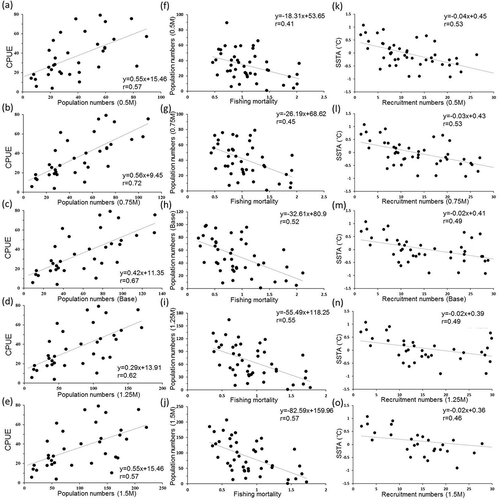
FIGURE 4. Changes in population at (a)–(f) ages 2–7 years for Grey Mullet in the Taiwan Strait, 1958–2004.
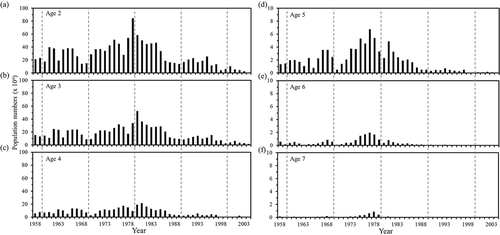
TABLE 3. Results of Pearson correlation analysis of the Grey Mullet population at ages 2–6 with varying M (0.50M, 0.75M, 1.00M, 1.25M, and 1.50M) against the annual mean Pacific Decadal Oscillation (PDO), Oceanic Nino Index (ONI), and winter sea surface temperature anomalies (SSTAs) for two periods (1958–1985, 1986–2004). An asterisk indicates significance at P < 0.05.
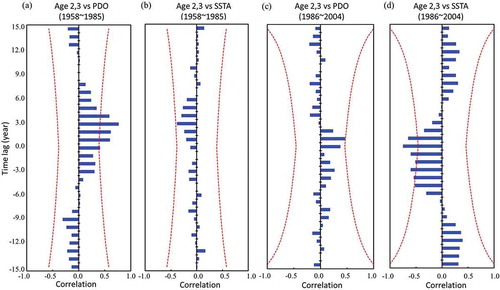
FIGURE 5. Cross-correlation function between recruitment numbers (ages 2–3) and (a), (c) average annual PDO and (b), (d) winter SSTAs for the periods 1958–1985 and 1986–2004. The two red dotted lines represent the limits of significance at the 5% level.