Figures & data
FIGURE 1. Map of the Northwest Atlantic continental shelf system, with major subregions and estuaries labeled.
FIGURE 2. Contributions of Atlantic Menhaden to the diets of predators in the balanced Northwest Atlantic continental shelf Ecopath model (stanzas: small [S], medium [M], and large [L]; HMS = highly migratory species; pisc. = piscivorous).
![FIGURE 2. Contributions of Atlantic Menhaden to the diets of predators in the balanced Northwest Atlantic continental shelf Ecopath model (stanzas: small [S], medium [M], and large [L]; HMS = highly migratory species; pisc. = piscivorous).](/cms/asset/69834f64-fb16-4b2b-adfd-833b1c765126/umcf_a_1360420_f0002_b.gif)
FIGURE 3. Biomass (metric tons [mt] per km2) fits for the ecosystem model of the Northwest Atlantic continental shelf. Lines depict the predicted biomass estimates by year; points depict the time series of relative biomass from stock assessments and fisheries surveys. Panels are labeled by trophic group number, abbreviation, and stanza (small [S], medium [M], and large [L]) if applicable (trophic groups: 15 = shrimp and similar species; 17 = Atlantic Herring; 19, 20, 21 = Atlantic Menhaden; 23 = Atlantic Mackerel; 24 = squid; 25 = Butterfish; 27, 28, 29 = Bluefish; 30, 31, 32 = Striped Bass; 34, 35 = Weakfish; 36, 37 = Spiny Dogfish; 38, 39, 40 = Atlantic Cod; 41 = Haddock Melanogrammus aeglefinus; 42 = hakes; 43 = Atlantic Croaker Micropogonias undulatus; 45 = Yellowtail Flounder Limanda ferruginea; 46, 47 = Summer Flounder; 48 = skates; 49 = demersal benthivores–other; 50 = demersal piscivores–other). Trophic groups without observed empirical data are excluded.
![FIGURE 3. Biomass (metric tons [mt] per km2) fits for the ecosystem model of the Northwest Atlantic continental shelf. Lines depict the predicted biomass estimates by year; points depict the time series of relative biomass from stock assessments and fisheries surveys. Panels are labeled by trophic group number, abbreviation, and stanza (small [S], medium [M], and large [L]) if applicable (trophic groups: 15 = shrimp and similar species; 17 = Atlantic Herring; 19, 20, 21 = Atlantic Menhaden; 23 = Atlantic Mackerel; 24 = squid; 25 = Butterfish; 27, 28, 29 = Bluefish; 30, 31, 32 = Striped Bass; 34, 35 = Weakfish; 36, 37 = Spiny Dogfish; 38, 39, 40 = Atlantic Cod; 41 = Haddock Melanogrammus aeglefinus; 42 = hakes; 43 = Atlantic Croaker Micropogonias undulatus; 45 = Yellowtail Flounder Limanda ferruginea; 46, 47 = Summer Flounder; 48 = skates; 49 = demersal benthivores–other; 50 = demersal piscivores–other). Trophic groups without observed empirical data are excluded.](/cms/asset/4a0b666e-e3b9-4d1c-9d63-d409b883ea32/umcf_a_1360420_f0003_oc.jpg)
FIGURE 4. Catch (metric tons [mt] per km2) fits for the ecosystem model of the Northwest Atlantic continental shelf. Observed (points) and predicted (lines) catch estimates by year are presented. Panels are labeled by trophic group number, abbreviation, and stanza (small [S], medium [M], and large [L]) if applicable (trophic groups: 11 = macrobenthos–molluscs; 13 = megabenthos–filterers; 14 = megabenthos–other; 15 = shrimp and similar species; 17 = Atlantic Herring; 18 = alosines; 19, 20, 21 = Atlantic Menhaden; 23 = Atlantic Mackerel; 24 = squid; 25 = Butterfish; 26 = small pelagic–other; 27, 28, 29 = Bluefish; 31, 32 = Striped Bass; 34, 35 = Weakfish; 37 = Spiny Dogfish; 38, 39, 40 = Atlantic Cod; 41 = Haddock; 42 = hakes; 43 = Atlantic Croaker; 45 = Yellowtail Flounder; 46, 47 = Summer Flounder; 48 = skates; 49 = demersal benthivores–other; 50 = demersal piscivores–other; 51 = demersal omnivores–other; 52 = medium pelagic–other; 53 = sharks–coastal; 54 = sharks–pelagic; 55 = large pelagics [highly migratory species]). Trophic groups without observed empirical data are excluded.
![FIGURE 4. Catch (metric tons [mt] per km2) fits for the ecosystem model of the Northwest Atlantic continental shelf. Observed (points) and predicted (lines) catch estimates by year are presented. Panels are labeled by trophic group number, abbreviation, and stanza (small [S], medium [M], and large [L]) if applicable (trophic groups: 11 = macrobenthos–molluscs; 13 = megabenthos–filterers; 14 = megabenthos–other; 15 = shrimp and similar species; 17 = Atlantic Herring; 18 = alosines; 19, 20, 21 = Atlantic Menhaden; 23 = Atlantic Mackerel; 24 = squid; 25 = Butterfish; 26 = small pelagic–other; 27, 28, 29 = Bluefish; 31, 32 = Striped Bass; 34, 35 = Weakfish; 37 = Spiny Dogfish; 38, 39, 40 = Atlantic Cod; 41 = Haddock; 42 = hakes; 43 = Atlantic Croaker; 45 = Yellowtail Flounder; 46, 47 = Summer Flounder; 48 = skates; 49 = demersal benthivores–other; 50 = demersal piscivores–other; 51 = demersal omnivores–other; 52 = medium pelagic–other; 53 = sharks–coastal; 54 = sharks–pelagic; 55 = large pelagics [highly migratory species]). Trophic groups without observed empirical data are excluded.](/cms/asset/9c20039c-8dd4-4aec-9e11-b2646bf9ee8d/umcf_a_1360420_f0004_oc.jpg)
FIGURE 5. Simulated trajectories of total Atlantic Menhaden biomass (metric tons [mt] per km2) under different future projections of fishing mortality for medium-stanza Atlantic Menhaden (Fmed.menh = 0–1.6/year) starting in 2014. Lines are model projections; points represent the time series of relative biomass from the Atlantic Menhaden stock assessments.
![FIGURE 5. Simulated trajectories of total Atlantic Menhaden biomass (metric tons [mt] per km2) under different future projections of fishing mortality for medium-stanza Atlantic Menhaden (Fmed.menh = 0–1.6/year) starting in 2014. Lines are model projections; points represent the time series of relative biomass from the Atlantic Menhaden stock assessments.](/cms/asset/be9d307a-a301-4480-b5c7-0bbc1fc2b979/umcf_a_1360420_f0005_oc.jpg)
FIGURE 6. Simulated trajectories of total Striped Bass biomass (metric tons [mt] per km2) under different future projections of fishing mortality for medium-stanza Atlantic Menhaden (Fmed.menh = 0–1.6/year) starting in 2014. Lines are model projections; points represent the time series of relative biomass from the Striped Bass stock assessments.
![FIGURE 6. Simulated trajectories of total Striped Bass biomass (metric tons [mt] per km2) under different future projections of fishing mortality for medium-stanza Atlantic Menhaden (Fmed.menh = 0–1.6/year) starting in 2014. Lines are model projections; points represent the time series of relative biomass from the Striped Bass stock assessments.](/cms/asset/9e77107f-8c85-40a9-a4fe-40d2abea8e28/umcf_a_1360420_f0006_oc.jpg)
FIGURE 7. Biomass of each trophic group for the scenario in which fishing mortality of medium-stanza Atlantic Menhaden (Fmed.menh) was equal to 1.20/year relative to each group’s biomass at Fmed.menh = 0/year (trophic groups: MacroB-poly = macrobenthos–polychaetes; Yflound = Yellowtail Flounder; MegaB-filt = megabenthos–filterers; MacroB-oth = macrobenthos–other; MacroB-moll = macrobenthos–molluscs; MacroB-crus = macrobenthos–crustaceans; Bact = bacteria; Herring = Atlantic Herring; Hake = hakes; Blue = Bluefish; Domni-oth = demersal omnivores–other; Weak = Weakfish; Dpisc-oth = demersal piscivores–other; Dbenth-oth = demersal benthivores–other; Odont = odontocetes; Shark-pel = sharks–pelagic; Pinn = pinnipeds; Seabird = seabirds; Shark-coas = sharks–coastal; HMS = large pelagics [highly migratory species]; Sbass = Striped Bass; Shorebird = shorebirds–piscivorous; Menh = Atlantic Menhaden; MedPel = medium pelagic–other; Cod = Atlantic Cod; Anch = anchovies; Croaker = Atlantic Croaker; Sflound = Summer Flounder; SmPel = small pelagic–other; Mack = Atlantic Mackerel; Microzoo = microzooplankton; Dogfish = Spiny Dogfish; PP-oth = primary producers–other; Butter = Butterfish; Mesopel = mesopelagics; MegaB-oth = megabenthos–other; Shrimp = shrimp and similar species; Cop-L = large copepods; Bwhale = baleen whales; Micronek = micronekton; GelZoop = gelatinous zooplankton; Skate = skates; Cop-S = small copepods; Phyto = phytoplankton).
![FIGURE 7. Biomass of each trophic group for the scenario in which fishing mortality of medium-stanza Atlantic Menhaden (Fmed.menh) was equal to 1.20/year relative to each group’s biomass at Fmed.menh = 0/year (trophic groups: MacroB-poly = macrobenthos–polychaetes; Yflound = Yellowtail Flounder; MegaB-filt = megabenthos–filterers; MacroB-oth = macrobenthos–other; MacroB-moll = macrobenthos–molluscs; MacroB-crus = macrobenthos–crustaceans; Bact = bacteria; Herring = Atlantic Herring; Hake = hakes; Blue = Bluefish; Domni-oth = demersal omnivores–other; Weak = Weakfish; Dpisc-oth = demersal piscivores–other; Dbenth-oth = demersal benthivores–other; Odont = odontocetes; Shark-pel = sharks–pelagic; Pinn = pinnipeds; Seabird = seabirds; Shark-coas = sharks–coastal; HMS = large pelagics [highly migratory species]; Sbass = Striped Bass; Shorebird = shorebirds–piscivorous; Menh = Atlantic Menhaden; MedPel = medium pelagic–other; Cod = Atlantic Cod; Anch = anchovies; Croaker = Atlantic Croaker; Sflound = Summer Flounder; SmPel = small pelagic–other; Mack = Atlantic Mackerel; Microzoo = microzooplankton; Dogfish = Spiny Dogfish; PP-oth = primary producers–other; Butter = Butterfish; Mesopel = mesopelagics; MegaB-oth = megabenthos–other; Shrimp = shrimp and similar species; Cop-L = large copepods; Bwhale = baleen whales; Micronek = micronekton; GelZoop = gelatinous zooplankton; Skate = skates; Cop-S = small copepods; Phyto = phytoplankton).](/cms/asset/5e440ec1-7fae-4f72-be67-4cd5c9c15ce4/umcf_a_1360420_f0007_b.gif)
FIGURE 8. Fishery yields of select trophic groups for the scenario in which fishing mortality of medium-stanza Atlantic Menhaden (Fmed.menh) was equal to 1.20/year relative to each group’s respective maximum fishery yield. Only species whose catches were driven by fishing mortality rates from stock assessments (as opposed to being driven by fishing effort more generally) are shown (trophic groups: Butter = Butterfish; Yflound = Yellowtail Flounder; Dogfish = Spiny Dogfish; Mack = Atlantic Mackerel; Herring = Atlantic Herring; Hake = hakes; Shrimp = shrimp and similar species; Sflound = Summer Flounder; Croaker = Atlantic Croaker; Cod = Atlantic Cod; Blue = Bluefish; Weak = Weakfish; Menh = Atlantic Menhaden; Sbass = Striped Bass).
FIGURE 9. Simulated relative biomass and fishery yields of key trophic groups over a range of fishing mortality rate scenarios for medium-stanza Atlantic Menhaden (Fmed.menh). Relative biomass (in blue) was calculated in reference to the scenario of Fmed.menh = 0/year, and relative yield (in red) was calculated relative to the group’s maximum value. Panels represent Bluefish (Blue), Atlantic Menhaden (Menh), Striped Bass (Sbass), and Weakfish (Weak) values for all stanzas (small, medium, and large) combined. Colored shading depicts the 90% interquantile range (which excludes the upper and lower 5%) of Monte Carlo runs at each level of F.
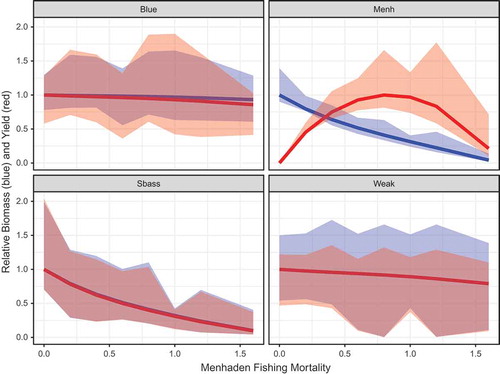
FIGURE 10. Simulated (a) relative biomass and (b) relative yield for Atlantic Menhaden and three predators as functions of fishing mortality scenarios for medium-stanza Atlantic Menhaden. Colored lines represent Bluefish (Blue), Atlantic Menhaden (Menh), Striped Bass (Sbass), and Weakfish (Weak), as labeled in panel a.
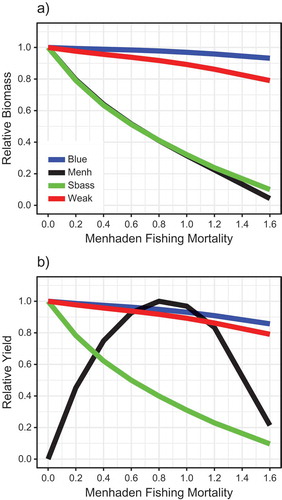
FIGURE 11. Percentages of (a) negatively impacted groups and (b) positively impacted groups resulting from different scenarios of fishing mortality for medium-stanza Atlantic Menhaden (Fmed.menh). Impacted groups (as a percentage of all n = 48 aggregated trophic groups) were defined as groups whose biomass decreased by ≥25% (IG–25%) or ≥50% (IG–50%) or groups whose biomass increased by ≥25% (IG+25%) or ≥50% (IG+50%) relative to the scenario of Fmed.menh = 0/year. Note that each trophic group with multiple stanzas (e.g., small, medium, and large Atlantic Menhaden) was combined and treated as a single aggregated group.
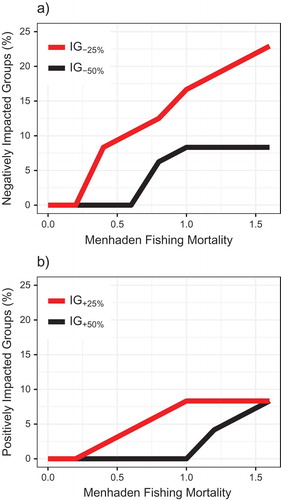
FIGURE 12. Prey-to-predator ratios (PPRs) for select groups as a function of fishing mortality for medium-stanza Atlantic Menhaden (Fmed.menh). The PPR is plotted for Atlantic Menhaden as prey and Bluefish (blue line), Striped Bass (green line), and Weakfish (red line) as predators. All PPRs were scaled to have a value of 1 at Fmed.menh = 0/year.
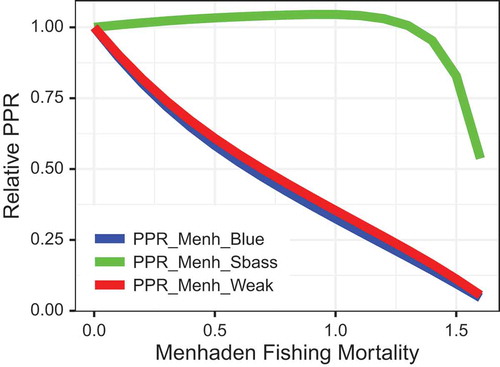
TABLE 1. Effects of Atlantic Menhaden fishing mortality (F) and biomass (B) reference points on three types of ecosystem indicators. See Methods text for a description of the reference points. Fishing mortality rates (per year) associated with each reference point are indicated within parentheses. Relative biomass for each species was defined as the biomass for the given F scenario divided by the biomass for the F = 0 scenario; thus, the relative biomass for Atlantic Menhaden is equivalent to B/B0, where B0 is the unfished biomass. Yield was calculated relative to the maximum yield attained.
FIGURE A.1.1. Relationship between fishing mortality (F) for medium-stanza Atlantic Menhaden in the Northwest Atlantic continental shelf model (Fmed.menh) and the geometric mean F for Atlantic Menhaden ages 2–4 (FGM2–4) from the single-species stock assessment (SEDAR Citation2015). Linear regression fit (dotted line), equation, and R2 value are included.
TABLE A.1.1. Fishing mortality rates (F) for Atlantic Menhaden. Age-specific F-values (1982–2013) are from the single-species (SS) stock assessment (Table 7.2.2.1 in SEDAR Citation2015). The F used in the Northwest Atlantic continental shelf (NWACS) model was calculated as catch divided by biomass for three different age stanzas (small [age-0], medium [ages 1–2], and large [age 3+]). The SS stock assessment reference points were determined based on the geometric mean (GM) for ages 2–4 (FGM2–4).
FIGURE A.2.1. Simulated (a) relative biomass and (b) relative yield for Atlantic Menhaden and three predators as functions of Atlantic Menhaden biomass. The Atlantic Menhaden biomass was calculated as B/B0, where B0 is biomass in the unfished scenario, holding all other model parameters and fishing rates constant. Colored lines represent Bluefish (Blue), Atlantic Menhaden (Menh), Striped Bass (Sbass), and Weakfish (Weak), as labeled in panel a.
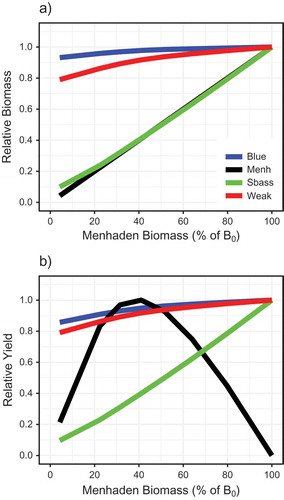
FIGURE A.2.2. Percentages of (a) negatively impacted groups and (b) positively impacted groups as a function of different Atlantic Menhaden biomass scenarios. Impacted groups (as a percentage of all n = 48 aggregated trophic groups) were defined as groups whose biomass decreased by ≥25% (IG–25%) or ≥50% (IG–50%) or groups whose biomass increased by ≥25% (IG+25%) or ≥50% (IG+50%) relative to the scenario in which fishing mortality of medium-stanza Atlantic Menhaden was zero. Atlantic Menhaden biomass is expressed as a percentage of unfished biomass (B0). Note that each trophic group with multiple stanzas (e.g., small, medium, and large Atlantic Menhaden) was combined and treated as a single aggregated group.
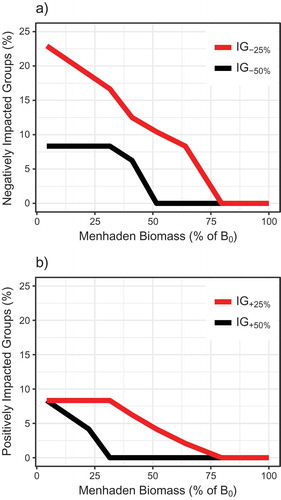
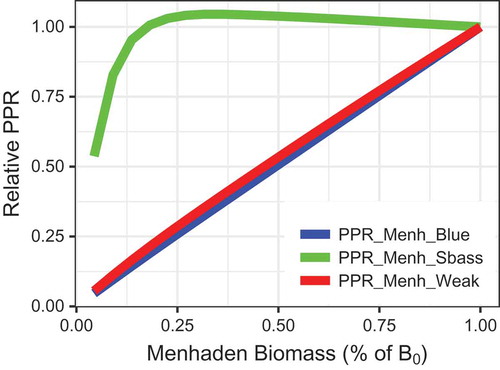
FIGURE A.2.3. Prey-to-predator ratios (PPRs) for select groups as a function of total Atlantic Menhaden biomass (expressed as a percentage of unfished biomass B0). The PPR is plotted for Atlantic Menhaden as prey and Bluefish (blue line), Striped Bass (green line), or Weakfish (red line) as predators. All PPRs were scaled to have a value of 1 when fishing mortality of medium-stanza Atlantic Menhaden was zero.