Figures & data
Table 1. Attribute details of bus lines.
Figure 1. An example of stated choice tasks (translated from Chinese).
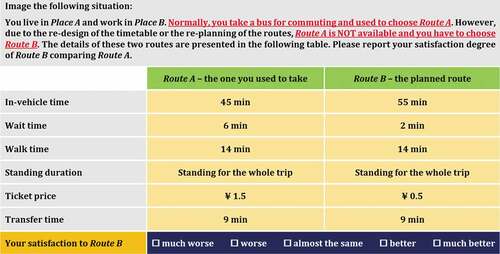
Table 2. Distribution of sample characteristics.
Table 3. The parameter values to generate synthetic data.
Table 4. Estimation results based on synthetic data (t values in the parenthesis).
Figure 2. Final log-likelihoods based on various numbers of scrambled Halton draws.
Table 5. Estimation results for the base model.
Table 6. Estimation results for the loss-attitude model.
Figure 3. Changes in attribute utility in terms of in-vehicle time.
Figure 4. Changes in attribute utility in terms of standing duration.
Figure 5. Responses to gains and losses in terms of in-vehicle time.
Figure 6. Responses to gains and losses in terms of standing duration.