
Figures & data
Figure 1. Number of trips in the Spring Festival travel rush for the latest 4 years (unit: 100 million)
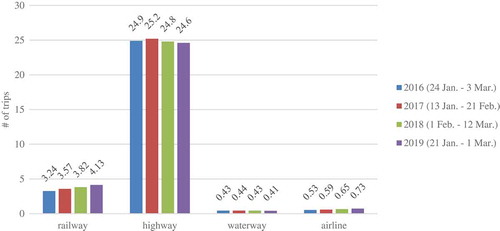
Table 1. Attributes and corresponding levels
Table 2. Descriptive statistics of respondents’ socio-demographic characteristics
Figure 2. Model structure
Table 3. Goodness of fit for the latent class nested logit models
Table 4. Estimation results for latent class nested logit model with two classes
Table 5. Willingness-to-pay for ticket type changing in conventional trains (class 1)
Table 6. Willingness-to-pay for ticket type changing in conventional trains (class 2)
Table 7. Willingness-to-pay for arrival time changing in conventional trains (class 1)
Table 8. Willingness-to-pay for arrival time changing in high-speed trains (class 1)
Table 9. Willingness-to-pay for arrival time changing in conventional trains (class 2)
Table 10. Willingness-to-pay for arrival time changing in high-speed trains (class 2)