
Figures & data
Figure 1. Proposed methodology for assessing the implementation of HOT lanes and/or cordon pricing in Abu Dhabi city.
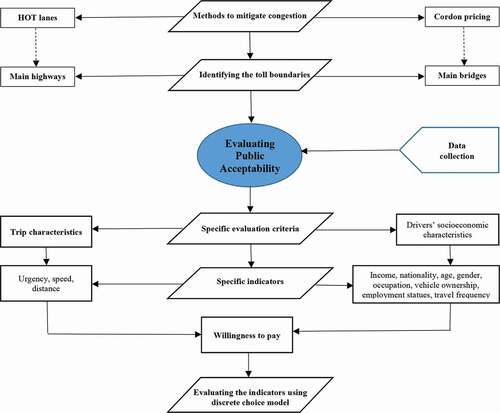
Table 1. Attributes used in modeling acceptability of congestion-pricing scenarios along with their levels
Figure 2. An example of WTP question included in the survey.
Figure 3. Major highways, cordon zone covering the four main bridges and survey locations in Abu Dhabi city.
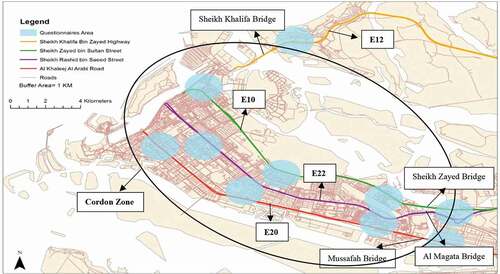
Table 2. Descriptive statistics on respondents’ commuting behavior and their socioeconomic characteristics
Figure 4. Importance of trip conditions on respondents’ willingness to pay (WTP) to avoid road congestion.
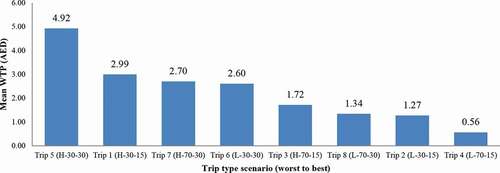
Table 3. Respondents’ mean willingness to pay (WTP) for different trip scenarios (I–VIII) differing in urgency, speed, and distance
Table 4. Respondents’ willingness to pay (WTP) for travel time saving based on trip conditions
Table 5. Effect of household income on willingness to pay (WTP) to reduce travel time using HOT lanes
Table 6. WTP based on different trip scenarios (I–VIII) as a function of trip conditions and respondents’ socioeconomic characteristics (R2 = 0.296)
Table 7. Parameter estimates of the logistics regression model on willingness to pay (WTP) for HOT lanes
Table 8. Parameter estimates of the logistics regression model on willingness to pay (WTP) for cordon pricing; Reference (Males) (R2 = 0.265)
Table 9. Effect of household income on drivers’ willingness to pay (WTP) to reduce travel time
Table 10. Multinomial logit analysis of drivers’ willingness to pay (WTP) to save 5, 10, 15, and 20 minutes of travel time (Reference high income (AED ≥24,999) (R2 = 0.409))
Table 11. Multinomial logit analysis of respondents’ perceptions of different ways of spending the revenue generated by congestion-charging schemes (R2 = 0.374)
Table 12. Acceptability studies across different regions in the world