Figures & data
Figure 1. Route schemes of flexible services. STOP Service-Route with a fixed layout and variable location of stops, LAYOUT Service-Route with variable layout, DIRECT Service- Taxi managed by a dispatching center
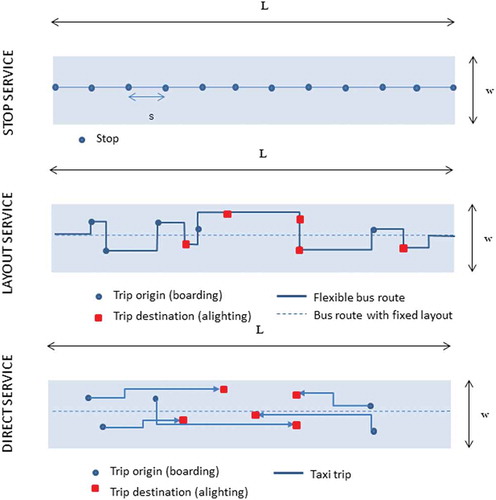
Table 1. Unit cost of the different bus powertrains considered
Figure 2. Optimization results in the corridor considering three scenarios
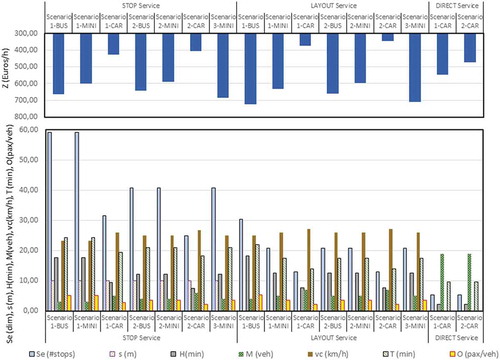
Figure 3. Variation of total and agency cost with regard to target headway in LAYOUT service
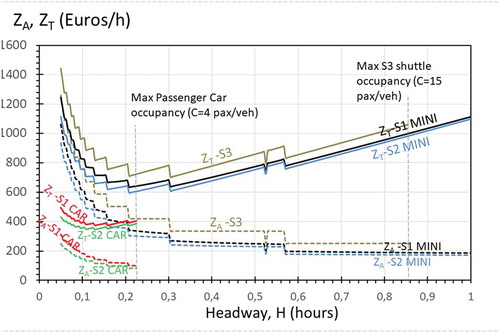
Figure 4. Variation of total and agency cost with regard to target waiting time in DIRECT service
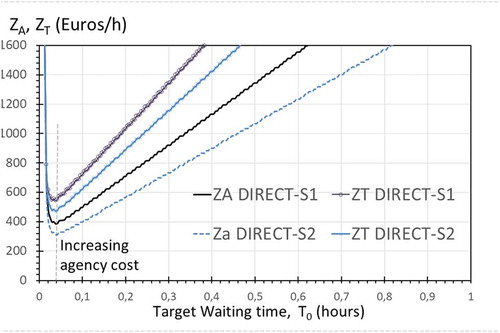
Figure 5. Variation of cost and performance metrics with regard to target headway in LAYOUT service
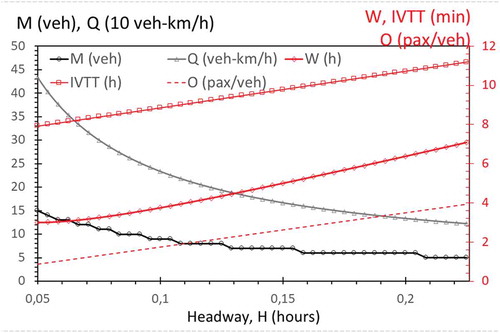
Figure 6. Variation of unit agency cost (zp) with regard to target headway (LAYOUT service) or target maximal waiting time (DIRECT service)
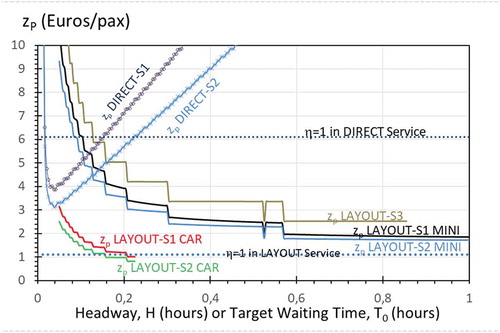
Figure 7. Unit total cost of the three services with regard to demand density
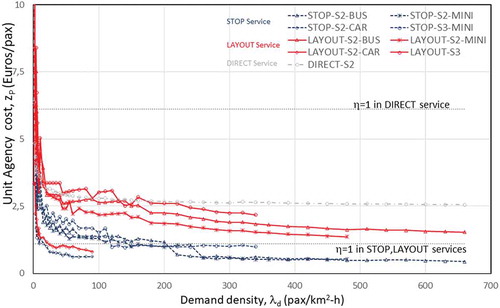
Figure 8. Unit agency cost of the three services with regard to demand density
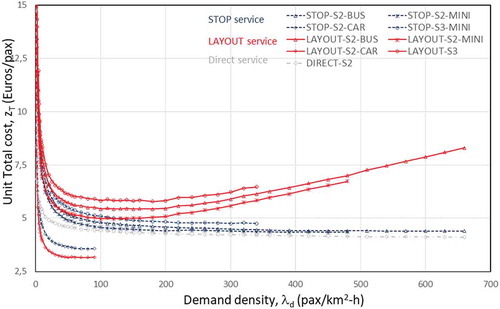
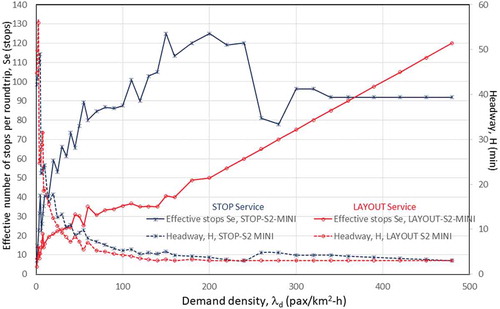
Figure 9. Number of effective stops (Se) and headway (H) with regard to demand density for STOP, and LAYOUT services operated by minibuses