Figures & data
Table 1. A summary of evidence from the literature on the efficiency of ridesourcing services
Figure 1. The total number of rides, active drivers, and the average number of rides per driver, by week of selected 200 drivers.
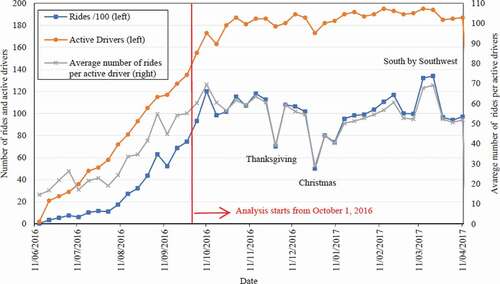
Figure 2. (a) Sample of RideAustin drivers’ working time flow, with empty trip segments shown in the dashed line. Travel segments of drivers in between two rides: (b) dispatched time after previous ride end; (c) dispatched time before previous ride end.
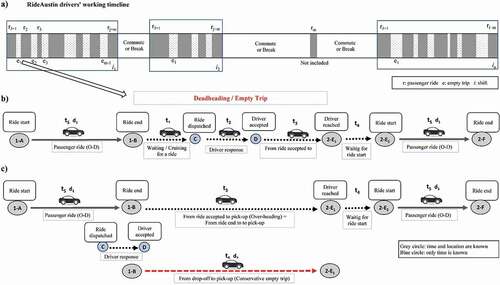
Figure 3. Components of two consecutive trips sample (representational, does not reflect the actual ride performed)
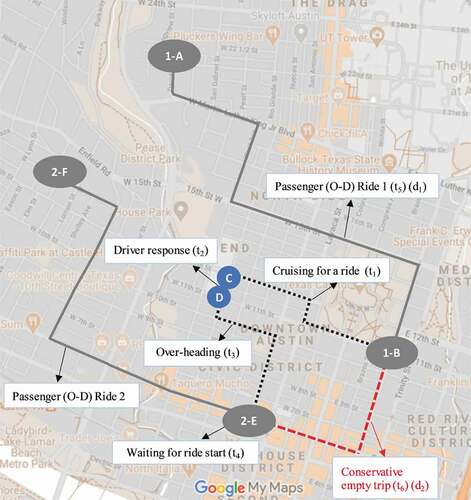
Figure 4. (a) The number of trips by the time of the day. (b) Average miles per trip by the time of day
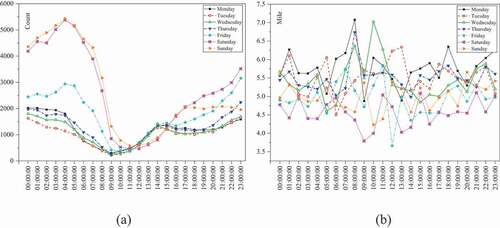
Figure 5. Cumulative distribution of passenger rides and empty trips in the drivers’ shift according to cutoff time limits (for 200 busiest drivers)
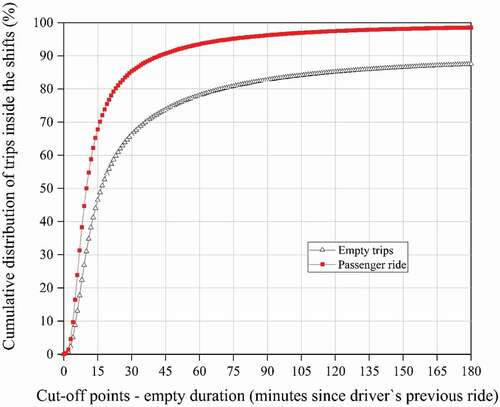
Figure 6. Mileage efficiency by time cutoff points for breaks
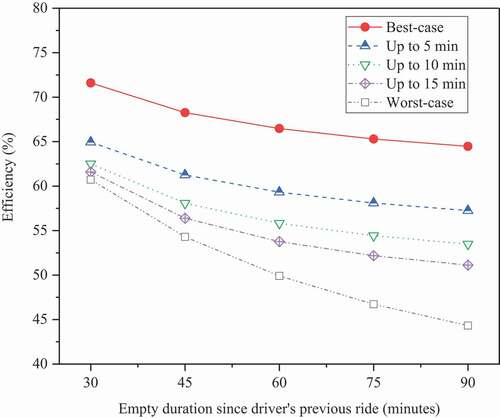
Figure 7. Distribution of the mileage efficiency of drivers for 60 minutes time limit: (a) by density; (b) by average working time per shift; (c) by the average number of trips per shift; (d) by the differences between scenarios
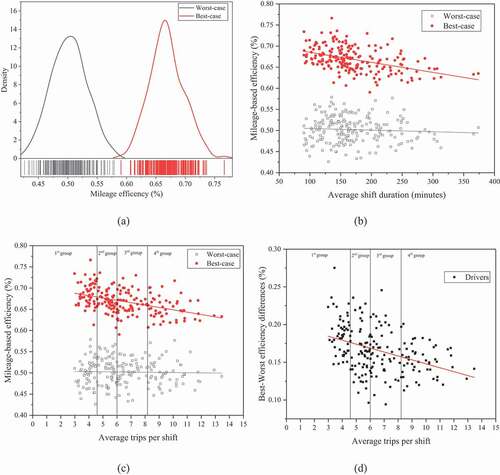
Table 2. Mileage efficiency rate statistic according to the category of drivers
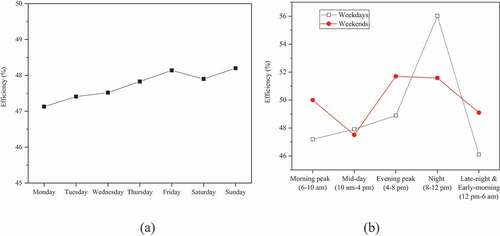
Figure 8. Mileage efficiency: by day of the week (a) worst-case, (b) best-case scenario; (c) by the time of day. (d) Number of drivers worked according to day of week and time of day
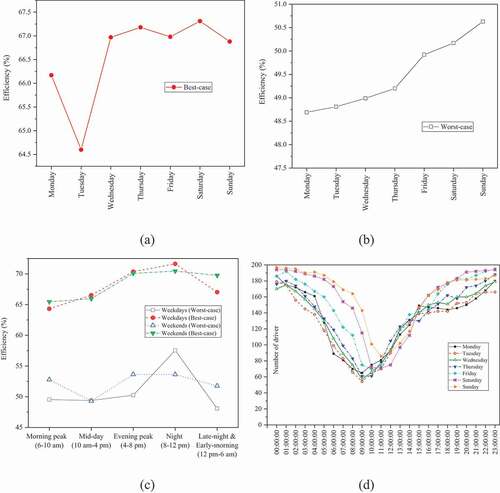
Figure 9. Time efficiency rate (a) by the time cutoff points for break (b) distribution of 200 drivers for 60 minutes time limit (c) by the average number of trips per shift
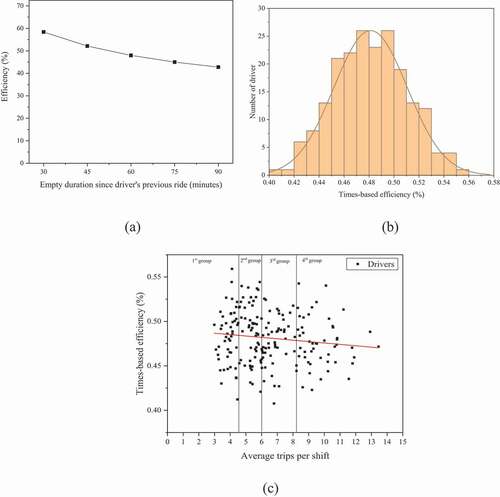
Figure 10. Time efficiency (a) by day of the week (b) by the time of day