Figures & data
Figure 1. Cumulative fare distributions within each mode (train or air), OD pair (Stockholm-Gothenburg and Stockholm-Malmö) and route (separating Bromma Airport (Bro) from Arlanda Airport (ARN)). Travel costs are given in SEK.Footnote2
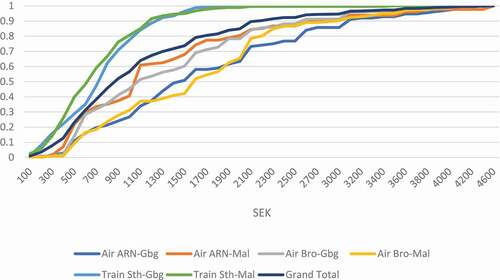
Figure 2. Distribution of ticket prices for air travel between Arlanda in Stockholm (ARN) and Gothenburg (Gbg).
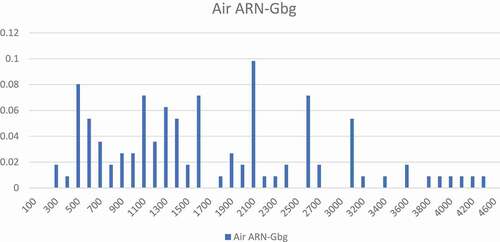
Figure 3. Fuel cost distribution for Swedish cars of model year 2000–2014.
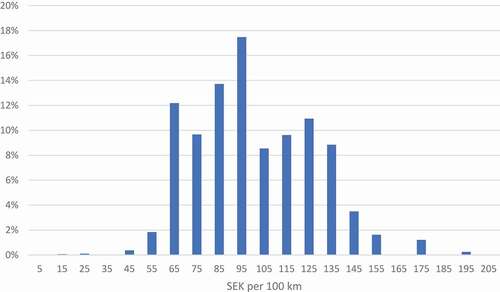
Table 1. Fuel costs in December 2014 in SEK per liter/kWh.
Figure 4. Train fare and fuel cost distribution for cars with model year 2000–2014 for the trip Stockholm – Gothenburg.
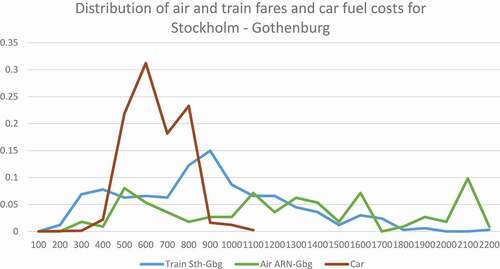
Table 2. Regression models of air traveler fares.Footnote3.
Table 3. Regression models of train traveler fares.3.
Figure 5. Fuel cost distribution for Swedish cars of model year 2000–2014 segmented by fuel type.
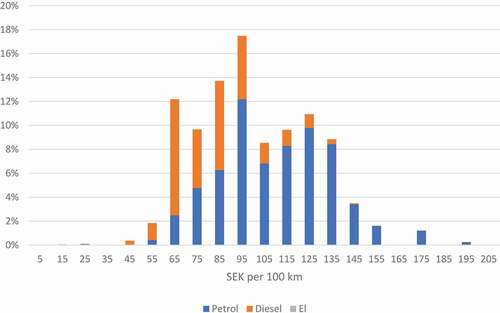
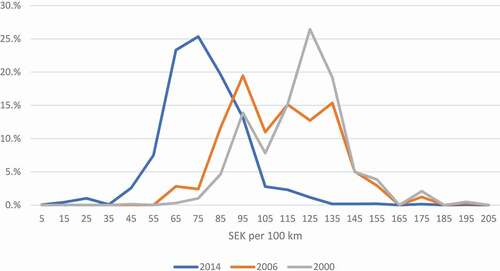
Figure 6. Fuel cost distribution for Swedish cars of model year 2000, 2006, and 2014, respectively.