Figures & data
Figure 1. Example of CAVs protecting HDVs, a) the prior situation b) accident situation with HDVs, c) accident avoided situation with CAVs.
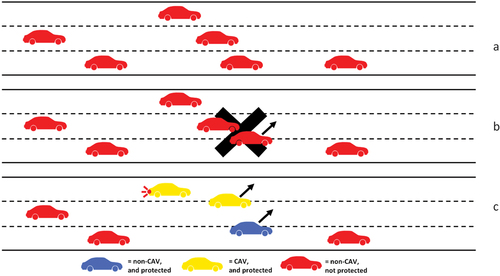
Figure 2. Demonstration of risk transmission and herd immunity in traffic.a) interaction between vehicles, b-d) transmission of risk with only HDVs, e-f) transmission of risk in mixed traffic showing the benefits of herd immunity
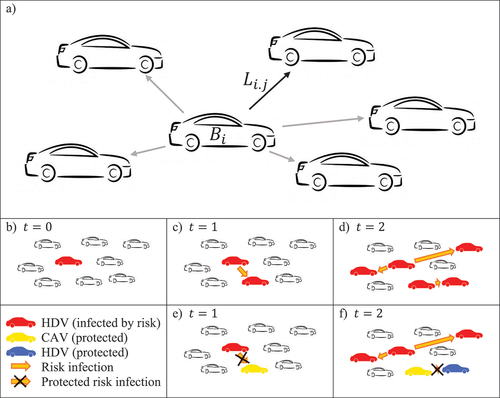
Figure 3. Final number of infected vehicles at the end of 100 time steps, average over seeded runs.
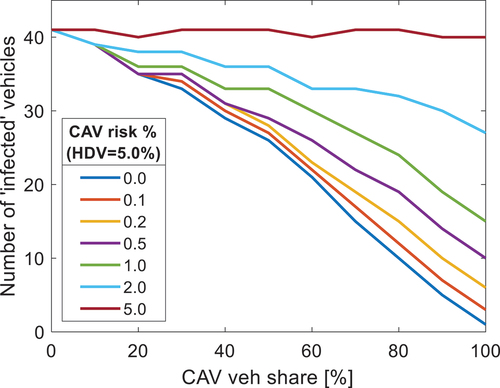
Figure 4. Case depiction: a) the prior situation b) accident situation with HDVs, c) accident avoided situation with CAVs.
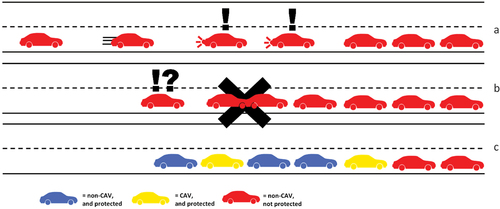
Figure 5. Depiction of vehicle trajectories for the case in . Red denotes a CAV. The black box denotes a place where herd-immunity improves safety.
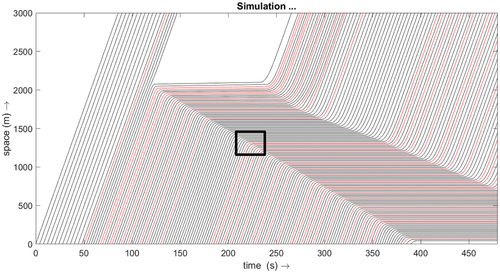
Figure 6. Results of the demonstrative case depicted in .
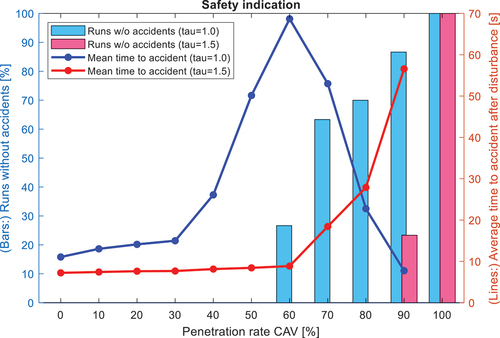
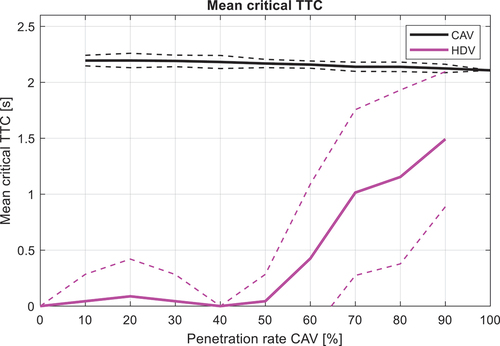
Figure 7. Mean critical TTC and standard deviation for the demonstrative case depicted in Figure 3.