
Figures & data
Figure 1. Components of one sample probe frame.
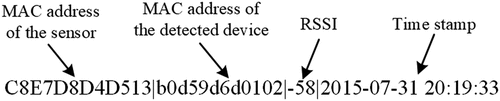
Figure 2. Device installations on various types of urban rail transit stations. (a) Island type platform. (b) Side type platforms.
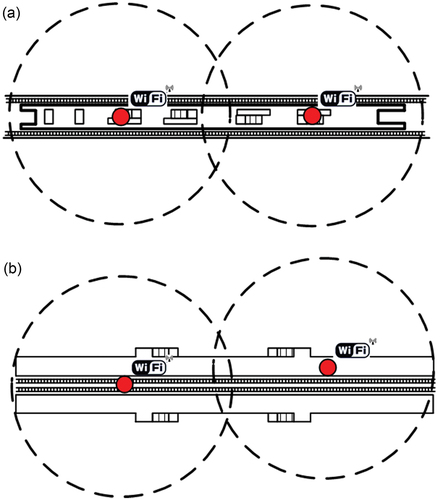
Figure 3. Patterns of the probe information at the station with two sensors.
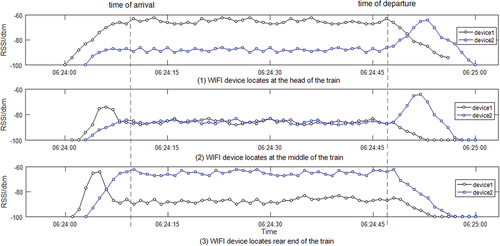
Figure 4. Framework of pattern recognition on transfer time.
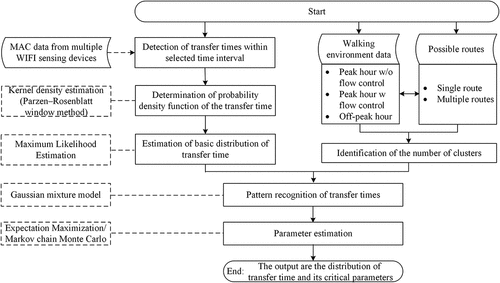
Figure 5. Layout and transfer routes of the Beidajie station.
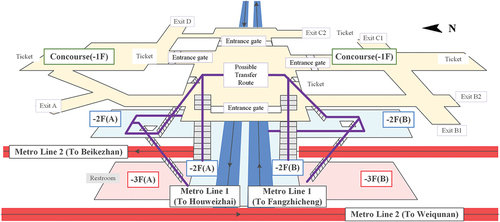
Figure 6. Variations of detected transfer time.
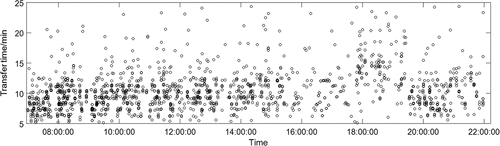
Figure 7. Comparison of transfer time between routes 1 and 2 at Beidajie station.
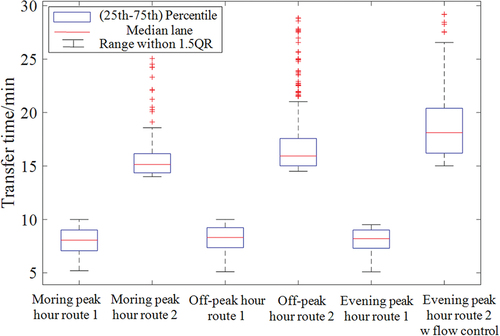
Figure 8. Comparison of transfer time characteristics estimated based on manually collected data and WIFI data.
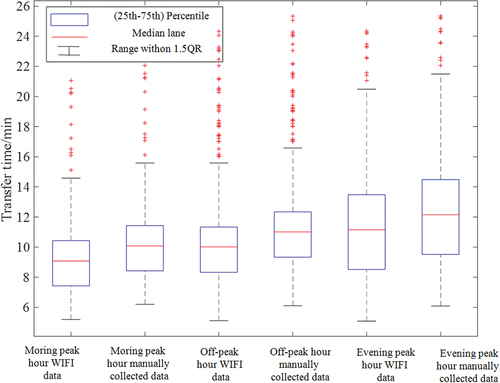
Figure 9. Analysis of the probability density of transfer time.
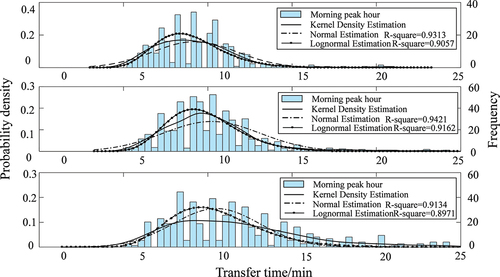
Table 1. Estimated parameters of the proposed distributions.
Figure 10. Extracted patterns of transfer time by GMM. (a) Estimation using GMM with normal distribution as base function. (b) Estimation using GMM with lognormal distribution as base function.
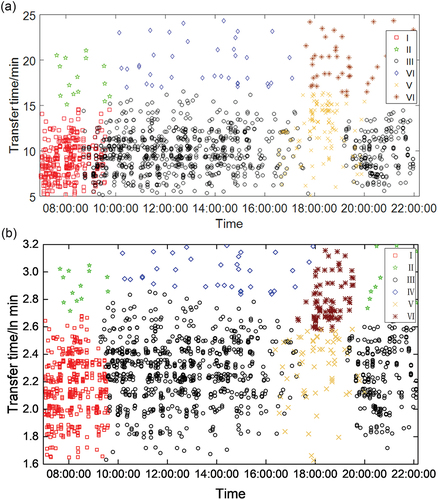
Table 2. Comparisons between parameters of GMM and manually collected data.