974
Views
16
CrossRef citations to date
0
Altmetric
Research articles

Atmospheric constraints on 2004 emissions of methane and nitrous oxide in North America from atmospheric measurements and a receptor-oriented modeling framework

, , , , , , , , , , , , , , & show all
Pages 125-133 | Received 15 Oct 2009, Accepted 18 Feb 2010, Published online: 18 Aug 2010

Figures & data

Figure 1. Average footprint of aircraft measurements (a) at LEF (b) at NHA (c) at CAR (d) of measurements made at the tall tower at LEF. Dynamic resolution is used in plotting, with grid boxes increasing in size at greater distances from receptor origin.
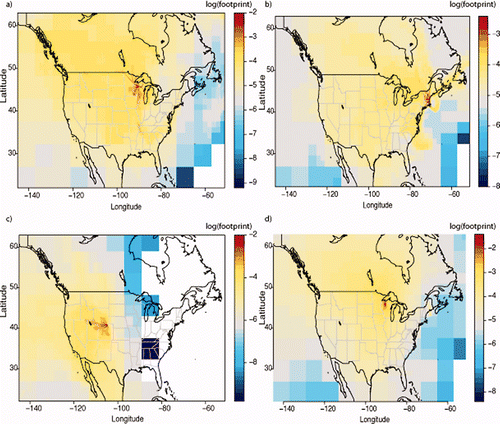
Figure 1. Average footprint of aircraft measurements (a) at LEF (b) at NHA (c) at CAR (d) of measurements made at the tall tower at LEF. Dynamic resolution is used in plotting, with grid boxes increasing in size at greater distances from receptor origin.

Figure 2. (a) Comparison of measured and modeled values at CAR with 1 to 1 line. (b) Average, binned vertical profile at CAR. (c) Modeled vs. measured with fit at LEF. (d) Average, binned vertical profile at LEF. (e) Modeled vs. measured with fit at NHA. (f) Average, binned vertical profile at NHA.
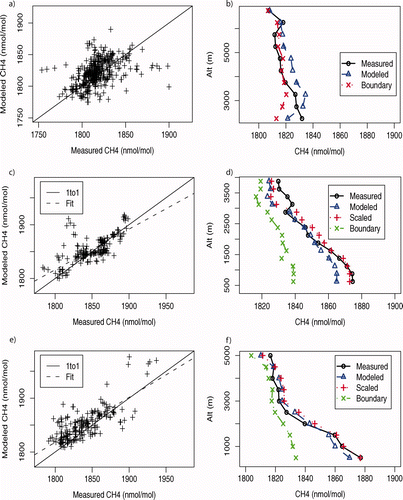
Figure 2. (a) Comparison of measured and modeled values at CAR with 1 to 1 line. (b) Average, binned vertical profile at CAR. (c) Modeled vs. measured with fit at LEF. (d) Average, binned vertical profile at LEF. (e) Modeled vs. measured with fit at NHA. (f) Average, binned vertical profile at NHA.
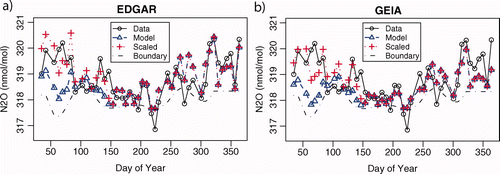
Figure 3. Percentage contribution of different source categories in the model (a) at LEF. (b) at NHA.

Figure 3. Percentage contribution of different source categories in the model (a) at LEF. (b) at NHA.

Figure 4. (a) Time series of measurements (black circle), boundary condition (black dashed), prior model with EDGAR (blue triangle), and the model scaled in late winter and spring (red cross). (b) same as (a), except the emissions model is GEIA.

Figure 4. (a) Time series of measurements (black circle), boundary condition (black dashed), prior model with EDGAR (blue triangle), and the model scaled in late winter and spring (red cross). (b) same as (a), except the emissions model is GEIA.

Reprints and Corporate Permissions

Please note: Selecting permissions does not provide access to the full text of the article, please see our help page How do I view content?

To request a reprint or corporate permissions for this article, please click on the relevant link below:

Academic Permissions

Please note: Selecting permissions does not provide access to the full text of the article, please see our help page How do I view content?

Obtain permissions instantly via Rightslink by clicking on the button below:

If you are unable to obtain permissions via Rightslink, please complete and submit this Permissions form. For more information, please visit our Permissions help page.