7,039
Views
1
CrossRef citations to date
0
Altmetric
Articles

Are peatland farming systems sustainable? Case study on assessing existing farming systems in the peatland of Central Kalimantan, Indonesia

, ORCID Icon &
Pages 1-19 | Received 02 Feb 2017, Accepted 29 Nov 2017, Published online: 21 Dec 2017

Figures & data

Table 1. Defined list of the attributes used in Modified-RAPFISH analysis.

Figure 1. Two dimensional ordination plots from MDS analyses in different dimensions.

Figure 1. Two dimensional ordination plots from MDS analyses in different dimensions.

Figure 2. Sustainability of Peatland Farming Systems in ecology, economic, social, institutional and technology & infrastructure dimensions based on Monte Carlo analysis.

Note: Error bars represent mean ± S.D. n = 25.

Figure 2. Sustainability of Peatland Farming Systems in ecology, economic, social, institutional and technology & infrastructure dimensions based on Monte Carlo analysis.Note: Error bars represent mean ± S.D. n = 25.

Table 2. Kurkal’s stress and RSQ for the different dimension.

Figure 3. Leverage values of attributes in different dimensions.

Figure 3. Leverage values of attributes in different dimensions.

Figure 4. Kite diagram representing the sustainability of different peatland farming systems in five dimensions.

Figure 4. Kite diagram representing the sustainability of different peatland farming systems in five dimensions.

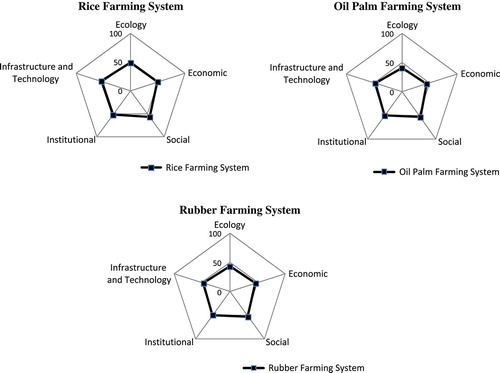
Table 3. Sustainability index from MDS analysis and Monte Carlo (MC) analysis.