Figures & data
Figure 1. Example of a choice card.
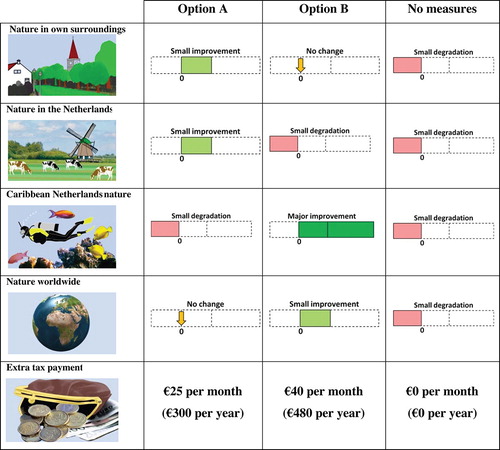
Table 1. Coefficient estimates and marginal effects in brackets of the attribute only models (left) and full choice models (right) for versions CE1 and CE2.
Table 2. Average WTP values (€ per month) for nature improvements according to the CE models.
Figure A1. Explanation of the attributes used in the choice experiment.
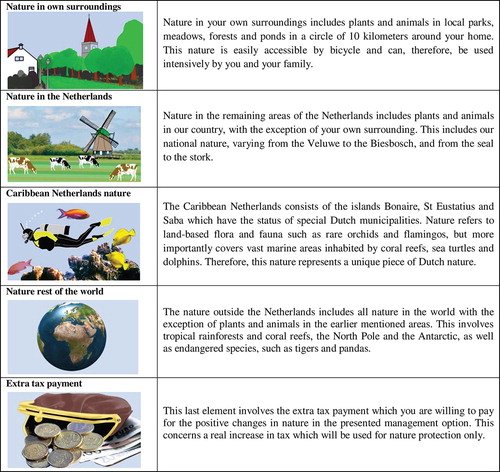
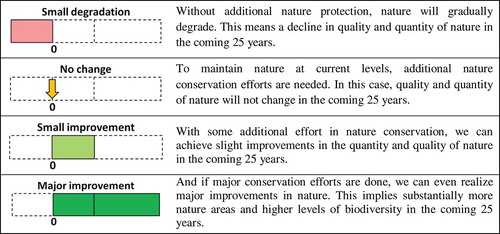
Figure A2. Levels of the nature attributes that were applied in the choice experiment.